
Fervo Energy Secures Additional $255 Million Funding to Meet Unprecedented Energy Demand
décembre 19, 2024
Fervo Energy Secures Additional $255 Million Funding to Meet Unprecedented Energy Demand
HOUSTON, TX (December 19, 2024) – Fervo Energy (“Fervo”), the leader in next-generation geothermal development, today announced that it has secured $255 million in new funding and capital availability as it continues to build the world’s largest enhanced geothermal systems (“EGS”) power development. The announced funding comprises both opportunistic corporate equity and new debt financing.
Capricorn’s Technology Impact Fund II led the $135 million corporate equity round. Fervo is excited to welcome new investment and continued support from a suite of high-caliber investors, including Breakthrough Energy Ventures, CalSTRS, Congruent Ventures, CPP Investments, DCVC, Devon Energy, Galvanize Climate Solutions, Liberty Mutual Investments, Mercuria, and Sabanci Climate Ventures.
“The demand for 24/7 carbon-free energy is at an all-time high, and Fervo is one of the only companies building large projects that will come online before the end of the decade,” said Fervo CEO and Co-Founder Tim Latimer. “Investors recognize that Fervo’s ability to get to scale quickly is vital in an evolving market that is seeing unprecedented energy demand from AI and other sources.”
In addition to corporate equity, Fervo secured a $120 million letter of credit and term loan facility from Mercuria, one of the world’s largest independent energy and commodity groups. The facility will provide additional liquidity for Fervo to accelerate the deployment of EGS projects across the U.S. as it seeks to meet skyrocketing demand for clean, firm power.
“In surveying power markets across the U.S. today, the need for next-generation geothermal is undeniable,” said Brian Falik, Group Chief Investment Officer of Mercuria. “We believe in Fervo not just because their EGS approach is cost-effective, commercially viable, and already being deployed at scale, but because they set ambitious targets and consistently deliver.”
Fervo’s first greenfield development, Cape Station, is now fully permitted up to 2 GW and will begin generating electricity in 2026. This project is just a first step. As Fervo continues to meet and surpass its stated development milestones, expect additional exciting updates in the near future.
#
About Fervo Energy
Fervo Energy provides 24/7 carbon-free energy through the development of next-generation geothermal power. Fervo’s mission is to leverage innovation in geoscience to accelerate the world’s transition to sustainable energy. Geothermal has a major role to play in the future electric grid, and Fervo’s key advancements in drilling and subsurface analytics bring a full suite of modern technology to make geothermal cost-competitive and globally scalable. For more information, please visit www.fervoenergy.com.
Aramco, Linde and SLB sign shareholders’ agreement for one of the largest CCS hubs globally December 4, 2024
décembre 11, 2024
https://www.aramco.com/en/news-media/news/2024/aramco-linde-and-slb-sign-shareholders-agreement-for-one-of-the-largest-ccs-hubs-globally
- Aramco and its partners reach milestone in building phase one of CCS hub in Jubail, signaling positive progress on the Company’s 2035 interim climate ambitions
- First phase construction expected to be completed in 2027, with capacity to capture and store up to 9 million metric tons of CO2 per year
- Project supports Aramco’s ambition to achieve net-zero and Scope 2 gas emissions across its wholly-owned operated assets by 2050, and its interim target of reducing Upstream by 15% by 2035
- CCS hub also complements the Company’s blue hydrogen and ammonia program, and aligns with the Kingdom’s net-zero objectives
Aramco, one of the world’s leading integrated energy and chemicals companies, has signed a shareholders’ agreement with Linde and SLB, paving the way for development of a Carbon Capture and Storage (CCS) hub that is expected to become one of the largest globally. Under the terms of the shareholders’ agreement Aramco will take a 60% equity interest in the CCS hub, with Linde and SLB each owning a 20% stake.
It represents a significant milestone for the project and is a key component in Aramco’s emission mitigation strategy. With the support of the Ministry of Energy, phase one of the new CCS hub in Jubail, in the Kingdom of Saudi Arabia’s Eastern Province, is expected to capture and store up to nine million metric tons of CO2 annually, and construction is expected to be completed by the end of 2027. Later phases are expected to further expand its capacity.
The project will support the company’s ambition to achieve net-zero Scope 1 and gas emissions across its wholly-owned operated assets by 2050.
SOCAR Discusses Carbon Capture And Geothermal Opportunities With DeGolyer And MacNaughton November 28, 2024
décembre 11, 2024
SOCAR Discusses Carbon Capture And Geothermal Opportunities With DeGolyer And MacNaughton
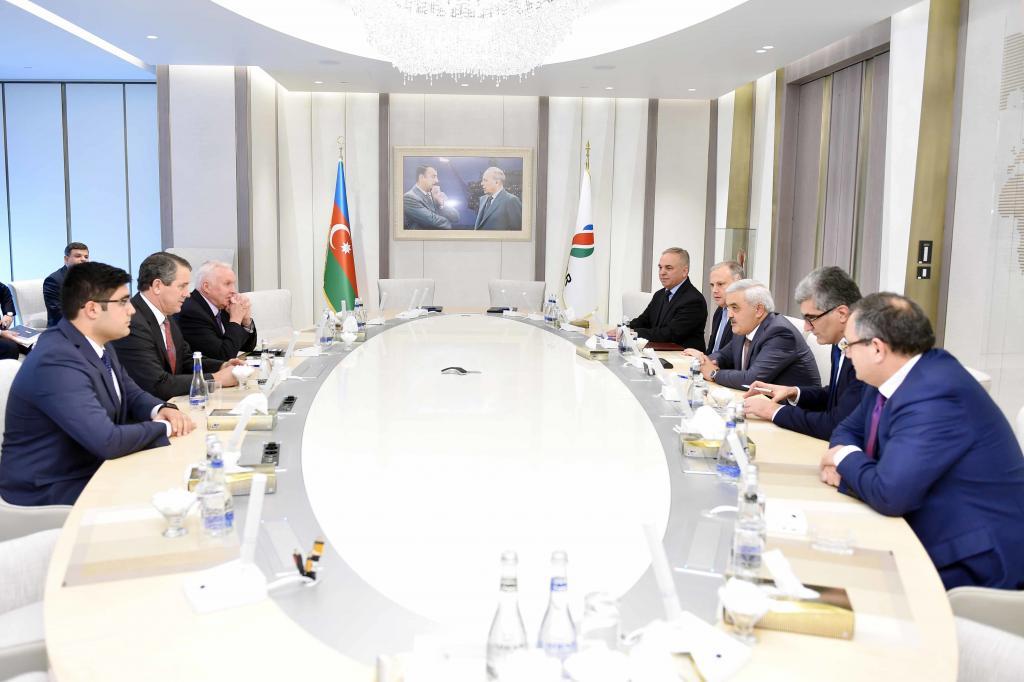
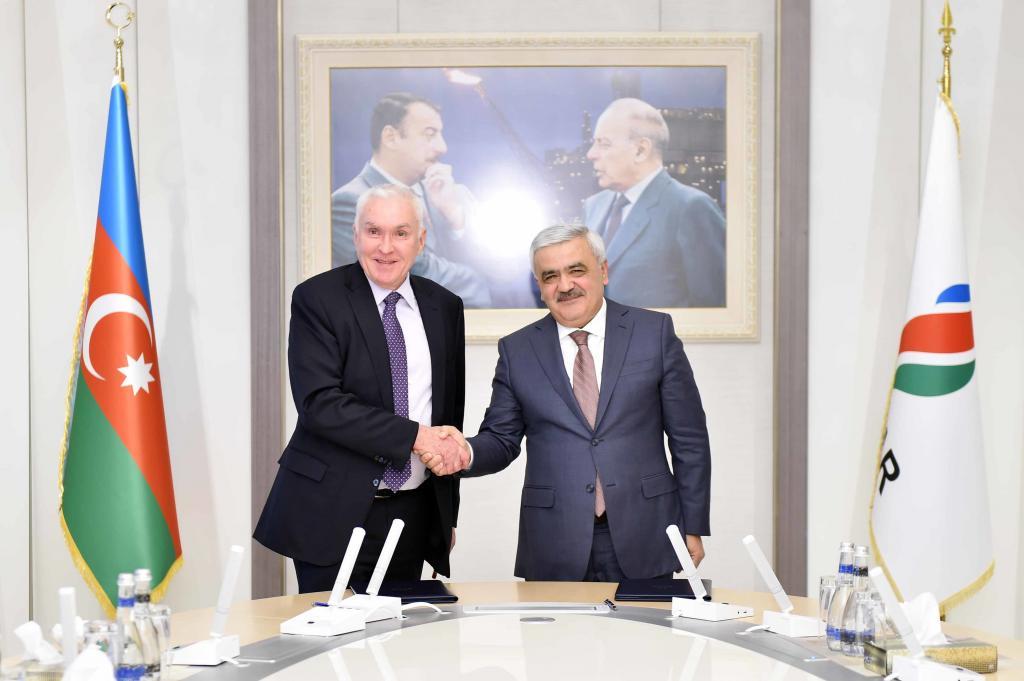
U.S. company DeGolyer and MacNaughton met with the State Oil Company of Azerbaijan (SOCAR) representatives and discussed potential opportunities to work together on carbon capture and geothermal projects.
SOCAR and DeGolyer and MacNaughton have an already established partnership for field development and determining reserves and their meeting follows COP29 which was held in Baku.
DeGolyer and MacNaughton is an independent oil industry consultancy with a focus on resources assessments, reserves consulting, reservoir modeling, geologic and petrophysical analyses.
This is not SOCAR’s first foray into carbon capture. In September 2024 the company signed a number of MOU’s with Italian energy giant Eni, with one of them focused on greenhouse gas reduction and energy efficiency through carbon capture, utilization and storage.
Last year the company also signed an agreement to work together with Abu Dhabi energy company ADNOC on hydrogen, carbon capture and geothermal.
D&M provides independent Competent Person’s Report (CPR) for anticipated combination of Harbour Energy plc and Wintershall Dea on the London Stock Exchange
juin 19, 2024
Publication of Circular and Prospectus | Harbour Energy
Harbour Energy plc
(“Harbour” or the “Company”)
Publication of Circular and Prospectus in connection with proposed acquisition of Wintershall Dea
asset portfolio
12 June 2024
Harbour is pleased to announce that it has today, following receipt of approval from the Financial
Conduct Authority (the « FCA »), published its shareholder circular (the “Circular”) and prospectus (the
“Prospectus”) in relation to the proposed acquisition of substantially all of Wintershall Dea AG’s
upstreamoil and gas assets(the “Target Portfolio”) (the “Acquisition”). A general meeting of Harbour’s
shareholders has been scheduled for 5 July 2024 to consider and approve the Acquisition.
DeGolyer and MacNaughton (“D&M”) have prepared an independent competent person’s report
(“CPR”) on the Target Portfolio, which is included in full in the Prospectus. D&M has certified that, as
at 31 December 2023, the target portfolio had 1,117 mmboe1 of 2P oil and gas reserves with an
estimated value (NPV10) of $10.5 billion2
. This excludes c.60 mmboe of reserves produced between
the effective date of the Acquisition of 30 June 2023 and 31 December 2023. In addition, as at 31
December 2023, D&M has certified that the Target Portfolio had 1,238 mmboe of 2C contingent
resources3
.
The publication of the Circular and Prospectus marks another important milestone towards
completion of the Acquisition. In addition, all regulatory, anti-trust and foreign direct investment
approvals continue to progress as planned. These include approvalsfrom Egypt’s Ministry of Petroleum
and Mineral Resources and the European Commission, which were recently received. Harbour
continues to expect the Acquisition to complete during the fourth quarter of 2024.
Harbour has made available copies of the Circular and Prospectus as well as a presentation
summarising the key highlights of the Prospectus on its website at https://www.harbourenergy.com.
Gazprom Neft improves efficiency in developing the Priobskoye field together with D&M Corp
juin 1, 2018
Gazprom Neft has entered into an agreement with American corporation DeGolyer and MacNaughton Corp. on the selection and utilisation of innovative enhanced oil recovery (EOR) techniques at its Priobskoye field, in a document signed at this year’s St Petersburg International Economic Forum by Vadim Yakovlev, First Deputy CEO, Gazprom Neft, and Martin Wiewiorowski, Director of D&M’s Russian Branch.
Under this agreement DeGolyer and MacNaughton specialists will, throughout 2018–2020, analyse the history of the Priobskoye field since its discovery, assess the potential for increasing production and increasing the oil recovery factor (ORF), formulate recommendations for realising this potential, and address immediate challenges and problems in developing the Yuzhny (Southern) licence block at the Priobskoye field. On the basis of this data, plans for pilot works and further geological prospecting at the asset will be put in place.
In addition to this, the process of analysing the appropriate cutting-edge technologies to be used will be initiated, and alternative approaches to solving field development problems developed. A programme for the further professional development of Gazprom Neft specialists will also be put in place.
According to Gazprom Neft specialists, the full implementation of programmes developed under the agreement with D&M will allow reserves at the Priobskoye field to be brought into development, will enhance oil recovery through existing well stock, and will increase the ORF by five to six percent.
DeGolyer and MacNaughton plans to open an office in St Petersburg in 2018 in order to undertake implementation of this project.
Vadim Yakovlev, First Deputy CEO, Gazprom Neft, commented: Gazprom Neft has been working with DeGolyer and MacNaughton for more than 10 years. The unique competencies accumulated by the company during annual reserves audits has become a key component in our joint project to study the potential of the Priobskoye field, initiated in 2016. I have every confidence that this new agreement will allow our companies to further strengthen their cooperation and, ultimately, significantly improve efficiency in developing one of our largest production assets. »
http://www.gazprom-neft.com/press-center/news/1646776/
Gazprom Neft improves efficiency in developing the Priobskoye field together with D&M Corp
juin 1, 2018
As one of the leading independent consulting firm focused on the petroleum industry, DeGolyer and MacNaughton provides unbiased and informed answers to clients worldwide. D&M skilfully blends energy economics, engineering, and the earth sciences to help clients in more than 100 countries make the smartest decisions regarding exploration, recovery, and management of oil and gas resources.
The firm’s services include resources assessments, reserves consulting, reservoir modelling, geologic and petrophysical analyses, development planning, guidance with financial reporting issues, and financial forecasting for petroleum discoveries. DeGolyer and MacNaughton has the largest, most experienced team of professional reservoir consultants in the industry. D&M has built up extensive international experience in independent reserves assessments, the results of which are frequently used in certifying projects for presentation to financial institutions worldwide.
Gazprom Neft is a vertically integrated oil company, primarily involved in oil and gas exploration and production, refining, and the production and sale of oil products. The Gazprom Neft’s corporate structure comprises more than 70 production, refining and sales subsidiaries throughout Russia, the CIS, and abroad.
The company’s proved and probable reserves (SPE-PRMS) are estimated at 2.78 billion tonnes of oil equivalent (btoe), making Gazprom Neft one of the top-20 largest oil and gas companies in the world, and one of Russia’s top three largest companies in terms of production and refining volumes. Total production in 2017 reached 89.75 million tonnes of oil equivalent (mtoe), with refining volumes of 40.1 million tonnes.
Gazprom Neft products are exported to more than 50 countries worldwide, and sold throughout the Russian Federation and abroad. The company’s filling station network totals more than 1,850 outlets throughout Russia, the CIS and Europe.
Gazprom Neft’s net profit in 2017 was RUB253 billion — a 26.5-percent increase year-on-year. The company is an industry market leader in terms of both financial growth and various efficiency metrics, including its internal rate of return (IRR).
The company’s main shareholder is Gazprom PJSC, which has a 95.68-percent interest, with the remaining shares in free circulation.
DeGolyer & MacNaughton to study Priobskoye EOR
juin 1, 2018
Gazprom-Neft has entered an agreement with DeGolyer & MacNaughton Corp., Dallas, on the selection and use of enhanced oil recovery methods for giant Priobskoye field in the Khanti-Mansi Autonomous District of West Siberia.
The Russian company said DeGolyer & MacNaughton will “analyze the history of the Priobskoye since its discovery, assess the potential for increasing production and increasing the oil recovery factor, formulate recommendations for realizing this potential, and address the immediate challenges and problems in developing the Yuzhny (Southern) license block” of the field. The work will occur during 2018-20.
In an April 2016 announcement about production of the 100 millionth tonne of oil from Yuzhno-Priobskoye, Gazprom-Neft said the field, known to have complex geology, was producing 32,000 tonnes/day from 2,000 wells.
https://www.ogj.com/articles/2018/05/degolyer-macnaughton-to-study-priobskoye-eor.html
EOG Resources: Reports Fourth Quarter and Full 2017 Results
avril 13, 2018
« For the 30th consecutive year, internal reserves estimates were within 5 percent of estimates independently prepared by DeGolyer and MacNaughton. »
EOG Resources, Inc. (NYSE: EOG) (EOG) today reported fourth quarter 2017 net income of $2,430 million, or $4.20 per share. This compares to a fourth quarter 2016 net loss of $142 million, or $0.25 per share. For the full year 2017, EOG reported net income of $2,583 million, or $4.46 per share, compared to a net loss of $1,097 million, or $1.98 per share, for the full year 2016.
Adjusted non-GAAP net income for the fourth quarter 2017 was $401 million, or $0.69 per share, compared to an adjusted non-GAAP net loss of $7 million, or $0.01 per share, for the same prior year period. Adjusted non-GAAP net income for the full year 2017 was $648 million, or $1.12 per share, compared to an adjusted non-GAAP net loss of $893 million, or $1.61 per share, for the full year 2016. Adjusted non-GAAP net income (loss) is calculated by matching hedge realizations to settlement months and making certain other adjustments in order to exclude non-recurring and certain other items. One of the adjusting items in the fourth quarter and full year 2017 was a non-cash reduction in income tax expense of $2.2 billion, or $3.75 per share, related to the revaluation of EOG’s deferred tax liability and certain other items resulting from the Tax Cuts and Jobs Act. For a reconciliation of non-GAAP measures to GAAP measures, please refer to the attached tables.
Higher commodity prices, increased production volumes, well productivity improvements and per-unit cost reductions resulted in significant increases to adjusted non-GAAP net income, discretionary cash flow and EBITDAX for the fourth quarter 2017 compared to the fourth quarter 2016. For a reconciliation of non-GAAP measures to GAAP measures, please refer to the attached tables.
Operational Highlights
Crude oil and condensate volumes in the U.S. increased 20 percent in 2017 to 335,000 barrels of oil per day (Bopd). Increased development activity and well productivity improvements supported the volume increase. Total company natural gas liquids (NGLs) volumes grew 8 percent while natural gas volumes decreased 6 percent primarily due to the sale of the company’s Barnett and Haynesville Shale dry gas assets in late 2016. Transportation expenses decreased 11 percent and depreciation, depletion and amortization expenses decreased 12 percent, on a per-unit basis.
Increased development activity drove substantial volume increases in the Eagle Ford and Delaware Basin during the fourth quarter. Total company crude oil and condensate volumes increased 40,200 Bopd compared to the third quarter 2017. Natural gas liquids volumes grew 15 percent while natural gas volumes increased 6 percent, compared to the third quarter 2017.
« EOG emerged from the industry downturn in 2017 with unprecedented levels of efficiency and productivity, driving oil production volumes to record levels with capital expenditures approximately one half the prior peak, » said William R. « Bill » Thomas, Chairman and Chief Executive Officer. « EOG’s integrated teams demonstrated superb operational performance, overcoming a major hurricane and other challenges to deliver record production volumes and cost savings which surpassed original targets set at the beginning of the year. »
2018 Capital Plan
EOG’s disciplined capital plan is designed to achieve strong returns on capital employed and healthy growth while spending within cash flow. The company expects to grow total company crude oil volumes by 18 percent, generate double-digit ROCE and cover capital investment and dividend payments within discretionary cash flow. EOG can deliver on its 2018 plan at oil prices below $50 and generates significant free cash flow at a $60 oil price.
EOG’s return-based culture continues to drive cost reductions. The company targets lower well costs and per-unit operating expenses in 2018 despite a potentially inflationary operating environment. EOG is also focused on driving continued improvements in well productivity and pursuing exploration efforts in new plays.
Capital expenditures for 2018 are expected to range from $5.4 to $5.8 billion, including production facilities and gathering, processing and other expenditures, and excluding acquisitions. EOG expects to complete approximately 690 net wells in 2018, compared to 536 net wells in 2017. Capital will be allocated primarily to EOG’s highest rate-of-return oil assets in the Delaware Basin, Eagle Ford, Rockies, Woodford and the Bakken.
At least 90 percent of the wells completed in 2018 are expected to be premium. EOG has an inventory of approximately 8,000 such wells, which have a direct after-tax rate of return of at least 30 percent assuming $40 flat crude oil prices and $2.50 flat natural gas prices.
« EOG enters 2018 better positioned than ever to generate significant shareholder value through the development of its large and diverse inventory of high rate-of-return premium wells, » Thomas said. « We are determined to maintain the discipline, record-level operational efficiency and performance gained through the downturn. Our deep inventory of premium wells across the U.S. offers flexibility to adjust to changing conditions. We also see significant opportunities to increase our premium well inventory through organic exploration and development technology to further extend EOG’s return on capital advantage. »
Dividend Increase
The board of directors increased the cash dividend on the common stock by 10.4 percent. Effective with the dividend payable April 30, 2018, to stockholders of record as of April 16, 2018, the board declared a quarterly dividend of $0.185 per share on the common stock. The indicated annual rate is $0.74 per share.
Delaware Basin
2017 was a watershed year for EOG in the Delaware Basin, where it successfully integrated the Yates acquisition, identified 1,240 additional net premium well locations, added the First Bone Spring as its fourth premium play and reduced completed well costs by $800,000 per well. Delaware Basin crude oil and condensate volumes increased over 80 percent in 2017 and exceeded 100,000 Bopd in the fourth quarter 2017.
EOG continued active development of its 416,000 net acre position in the Delaware Basin in the fourth quarter 2017, completing 65 wells.
In the Delaware Basin Wolfcamp, in Lea County, NM, EOG completed a four-well package, the Calm Breeze 2 Fed Com #701-704H, with an average treated lateral length of 7,100 feet per well and average 30-day initial production rates per well of 2,605 Bopd, 440 barrels per day (Bpd) of NGLs and 3.7 million cubic feet per day (MMcfd) of natural gas.
In the Delaware Basin First Bone Spring, in Lea County, NM, EOG completed the Righteous 6 State Com #301H with a treated lateral length of 7,100 feet and 30-day initial production rate of 1,305 Bopd, 170 Bpd of NGLs and 1.4 MMcfd of natural gas.
In the Delaware Basin Leonard, in Loving County, TX, EOG completed a four-well package, the State Atlas A#3H – D#6H, with an average treated lateral length of 9,800 feet per well and average 30-day initial production rates per well of 1,215 Bopd, 270 Bpd of NGLs and 2.3 MMcfd of natural gas.
South Texas Eagle Ford and Austin Chalk
EOG continues to enhance the productivity of its bellwether asset in the South Texas Eagle Ford. Eight years after initiating development, EOG further reduced well costs and improved well performance during 2017 in its 520,000 net acre position in the crude oil window of this world class play. EOG also expanded its enhanced oil recovery program, adding 56 wells last year. For the full year 2017, crude oil production in the Eagle Ford and Austin Chalk increased one percent year-over-year despite interruption to producing volumes as a result of Hurricane Harvey.
In the fourth quarter, EOG completed 74 wells in the Eagle Ford. These included 13 wells with lateral lengths of more than 10,000 feet. In LaSalle County, EOG completed a four-well package, the White 5H-8H, with an average treated lateral length of 12,900 feet per well and average 30-day initial production rates per well of 1,545 Bopd, 80 Bpd of NGLs and 0.5 MMcfd of natural gas. In DeWitt County, EOG completed a four-well package, the Hendrix 8H-10H and the Hendrix 12H, with an average treated lateral length of 6,700 feet per well and average 30-day initial production rates per well of 2,545 Bopd, 420 Bpd of NGLs and 2.4 MMcfd of natural gas.
EOG continued to test its position in the South Texas Austin Chalk, a geologically complex formation which lies above the South Texas Eagle Ford, completing four net wells in the fourth quarter.
Rockies
EOG’s Wyoming Powder River Basin and DJ Basin activity both contributed to the company’s 2017 crude oil production growth. In the Powder River Basin, EOG continued exploration activity on its 400,000 net acre position in the core of the play. The company tested the prospectivity of multiple target zones and also tested the aerial extent of various targets in the Powder River Basin during the year. In the DJ Basin, EOG achieved significant well cost reductions during 2017 through a focus on efficiency improvements in drilling and completion operations.
In the fourth quarter, EOG completed nine wells in the Powder River Basin. In Converse County, EOG completed the Mary’s Draw 453-0310H and 455-0310H wells with an average treated lateral length of 7,300 feet per well and average 30-day initial production rates per well of 1,280 Bopd, 610 Bpd of NGLs and 7.6 MMcfd of natural gas. In the DJ Basin, EOG completed three wells in the fourth quarter. This included the Big Sandy 522-2536H with a treated lateral length of 8,800 feet and 30-day initial production rate of 1,100 Bopd, 110 Bpd of NGLs and 0.2 MMcfd of natural gas.
Reserves
At year-end 2017, total company net proved reserves were 2,527 million barrels of oil equivalent (MMBoe), an increase of 18 percent compared to year-end 2016. Net proved reserve additions from all sources, excluding revisions due to price, replaced 201 percent of EOG’s 2017 production at a finding and development cost of $8.71 per barrel of oil equivalent. Revisions due to price increased net proved reserves by 154 MMBoe and asset divestitures decreased net proved reserves by 21 MMBoe. (For more reserves detail and a reconciliation of non-GAAP measures to GAAP measures, please refer to the attached tables.)
For the 30th consecutive year, internal reserves estimates were within 5 percent of estimates independently prepared by DeGolyer and MacNaughton.
Hedging Activity
During the fourth quarter ended December 31, 2017, EOG entered into crude oil financial price swap contracts and differential basis swap contracts. A comprehensive summary of crude oil and natural gas derivative contracts is provided in the attached tables.
Capital Structure and Asset Sales
At December 31, 2017, EOG’s total debt outstanding was $6.4 billion with a debt-to-total capitalization ratio of 28 percent. Considering cash on the balance sheet at the end of the fourth quarter, EOG’s net debt was $5.6 billion with a net debt-to-total capitalization ratio of 25 percent. For a reconciliation of non-GAAP measures to GAAP measures, please refer to the attached tables.
Proceeds from asset sales for the full year 2017 totaled $227 million.
Conference Call February 28, 2018
EOG’s fourth quarter and full year 2017 results conference call will be available via live audio webcast at 8 a.m. Central time (9 a.m. Eastern time) on Wednesday, February 28, 2018. To access the live audio webcast and related presentation materials, log on to the Investors Overview page on the EOG website at http://investors.eogresources.com/overview.
EOG Resources, Inc. is one of the largest independent (non-integrated) crude oil and natural gas companies in the United States with proved reserves in the United States, Trinidad, the United Kingdom and China. EOG Resources, Inc. is listed on the New York Stock Exchange and is traded under the ticker symbol « EOG. » For additional information about EOG, please visit www.eogresources.com.
This press release includes forward-looking statements within the meaning of Section 27A of the Securities Act of 1933, as amended, and Section 21E of the Securities Exchange Act of 1934, as amended. All statements, other than statements of historical facts, including, among others, statements and projections regarding EOG’s future financial position, operations, performance, business strategy, returns, budgets, reserves, levels of production, costs and asset sales, statements regarding future commodity prices and statements regarding the plans and objectives of EOG’s management for future operations, are forward-looking statements. EOG typically uses words such as « expect, » « anticipate, » « estimate, » « project, » « strategy, » « intend, » « plan, » « target, » « goal, » « may, » « will, » « should » and « believe » or the negative of those terms or other variations or comparable terminology to identify its forward-looking statements. In particular, statements, express or implied, concerning EOG’s future operating results and returns or EOG’s ability to replace or increase reserves, increase production, reduce or otherwise control operating and capital costs, generate income or cash flows or pay dividends are forward-looking statements. Forward-looking statements are not guarantees of performance. Although EOG believes the expectations reflected in its forward-looking statements are reasonable and are based on reasonable assumptions, no assurance can be given that these assumptions are accurate or that any of these expectations will be achieved (in full or at all) or will prove to have been correct. Moreover, EOG’s forward-looking statements may be affected by known, unknown or currently unforeseen risks, events or circumstances that may be outside EOG’s control. Furthermore, EOG has presented or referenced herein or in its accompanying disclosures certain forward-looking, non-GAAP financial measures, such as free cash flow and discretionary cash flow, and certain related estimates regarding future performance, results and financial position. These forward-looking measures and estimates are intended to be illustrative only and are not intended to reflect the results that EOG will necessarily achieve for the period(s) presented. EOG’s actual results may differ materially from the measure and estimates presented or referenced herein. Important factors that could cause EOG’s actual results to differ materially from the expectations reflected in EOG’s forward-looking statements include, among others:
- the timing, extent and duration of changes in prices for, supplies of, and demand for, crude oil and condensate, natural gas liquids, natural gas and related commodities;
- the extent to which EOG is successful in its efforts to acquire or discover additional reserves;
- the extent to which EOG is successful in its efforts to economically develop its acreage in, produce reserves and achieve anticipated production levels from, and maximize reserve recovery from, its existing and future crude oil and natural gas exploration and development projects;
- the extent to which EOG is successful in its efforts to market its crude oil and condensate, natural gas liquids, natural gas and related commodity production;
- the availability, proximity and capacity of, and costs associated with, appropriate gathering, processing, compression, transportation and refining facilities;
- the availability, cost, terms and timing of issuance or execution of, and competition for, mineral licenses and leases and governmental and other permits and rights-of-way, and EOG’s ability to retain mineral licenses and leases;
- the impact of, and changes in, government policies, laws and regulations, including tax laws and regulations; environmental, health and safety laws and regulations relating to air emissions, disposal of produced water, drilling fluids and other wastes, hydraulic fracturing and access to and use of water; laws and regulations imposing conditions or restrictions on drilling and completion operations and on the transportation of crude oil and natural gas; laws and regulations with respect to derivatives and hedging activities; and laws and regulations with respect to the import and export of crude oil, natural gas and related commodities;
- EOG’s ability to effectively integrate acquired crude oil and natural gas properties into its operations, fully identify existing and potential problems with respect to such properties and accurately estimate reserves, production and costs with respect to such properties;
- the extent to which EOG’s third-party-operated crude oil and natural gas properties are operated successfully and economically;
- competition in the oil and gas exploration and production industry for the acquisition of licenses, leases and properties, employees and other personnel, facilities, equipment, materials and services;
- the availability and cost of employees and other personnel, facilities, equipment, materials (such as water) and services;
- the accuracy of reserve estimates, which by their nature involve the exercise of professional judgment and may therefore be imprecise;
- weather, including its impact on crude oil and natural gas demand, and weather-related delays in drilling and in the installation and operation (by EOG or third parties) of production, gathering, processing, refining, compression and transportation facilities;
- the ability of EOG’s customers and other contractual counterparties to satisfy their obligations to EOG and, related thereto, to access the credit and capital markets to obtain financing needed to satisfy their obligations to EOG;
- EOG’s ability to access the commercial paper market and other credit and capital markets to obtain financing on terms it deems acceptable, if at all, and to otherwise satisfy its capital expenditure requirements;
- the extent to which EOG is successful in its completion of planned asset dispositions;
- the extent and effect of any hedging activities engaged in by EOG;
- the timing and extent of changes in foreign currency exchange rates, interest rates, inflation rates, global and domestic financial market conditions and global and domestic general economic conditions;
- political conditions and developments around the world (such as political instability and armed conflict), including in the areas in which EOG operates;
- the use of competing energy sources and the development of alternative energy sources;
- the extent to which EOG incurs uninsured losses and liabilities or losses and liabilities in excess of its insurance coverage;
- acts of war and terrorism and responses to these acts;
- physical, electronic and cyber security breaches; and
- the other factors described under ITEM 1A, Risk Factors, on pages 14 through 23 of EOG’s Annual Report on Form 10-K for the fiscal year ended December 31, 2017, and any updates to those factors set forth in EOG’s subsequent Quarterly Reports on Form 10-Q or Current Reports on Form 8-K.
In light of these risks, uncertainties and assumptions, the events anticipated by EOG’s forward-looking statements may not occur, and, if any of such events do, we may not have anticipated the timing of their occurrence or the duration and extent of their impact on our actual results. Accordingly, you should not place any undue reliance on any of EOG’s forward-looking statements. EOG’s forward-looking statements speak only as of the date made, and EOG undertakes no obligation, other than as required by applicable law, to update or revise its forward-looking statements, whether as a result of new information, subsequent events, anticipated or unanticipated circumstances or otherwise.
The United States Securities and Exchange Commission (SEC) permits oil and gas companies, in their filings with the SEC, to disclose not only « proved » reserves (i.e., quantities of oil and gas that are estimated to be recoverable with a high degree of confidence), but also « probable » reserves (i.e., quantities of oil and gas that are as likely as not to be recovered) as well as « possible » reserves (i.e., additional quantities of oil and gas that might be recovered, but with a lower probability than probable reserves). Statements of reserves are only estimates and may not correspond to the ultimate quantities of oil and gas recovered. Any reserve estimates provided in this press release that are not specifically designated as being estimates of proved reserves may include « potential » reserves and/or other estimated reserves not necessarily calculated in accordance with, or contemplated by, the SEC’s latest reserve reporting guidelines. Investors are urged to consider closely the disclosure in EOG’s Annual Report on Form 10-K for the fiscal year ended December 31, 2017, available from EOG at P.O. Box 4362, Houston, Texas 77210-4362 (Attn: Investor Relations). You can also obtain this report from the SEC by calling 1-800-SEC-0330 or from the SEC’s website at www.sec.gov. In addition, reconciliation and calculation schedules for non-GAAP financial measures can be found on the EOG website at www.eogresources.com.
DNO ASA 2017 Annual Statement of Reserves and Resources
mars 16, 2018
DNO ASA, the Norwegian oil and gas operator, today released its 2017 Annual Report and Accounts together with its 2017 Annual Statement of Reserves and Resources, reporting an increase in operating profit and improvements across other key financial and operational metrics.
Founded in 1971 and listed on the Oslo Stock Exchange with the code DNO. OL, the company holds stakes in onshore and offshore licences at various stages of exploration, development and production in the Kurdistan region of Iraq, Yemen, Oman, the United Arab Emirates, Tunisia and Somaliland. Its largest shareholder is UAE-based RAK Petroleum.
Annual 2017 revenues climbed to US$ 347 million, up 72 percent from the 2016 figures, the company said. Operating profit totalled US$ 521 million, up from US$ 6 million in 2016, with the recognition as other income of US$ 556 million under the August 2017 Kurdistan Receivables Settlement Agreement. Excluding the settlement agreement and non-cash impairments, DNO operating profit in 2017 more than doubled to US$ 72 million. Although operational expenditure last year reached US$ 259 million, double the 2016 figure, the company ended 2017 with a cash balance of USD 430 million.
Company Working Interest, CWI, production increased to 73,700 barrels of oil equivalent per day (boepd) from 69,200 boepd in 2016. Total production from DNO-operated fields, including those in which other companies have stakes, rose to 113,500 boepd in 2017, up from 112,600 boepd in 2016. Lifting costs last year averaged US$ 3.6 per barrel of oil equivalent.
DNO’s production continues to be driven by the Tawke field in Kurdistan, where output in 2017 averaged 105,500 barrels of oil per day (bopd). The adjacent Peshkabir field, brought on stream in the middle of 2017, contributed another 3,600 bopd to bring total Tawke licence production to 109,100 bopd for the year. DNO plans to boost production from this licence area in 2018 by drilling ten new wells, the report said.
“We are committed this year (2018) to continue to outdrill, outproduce and outperform all other international companies in Kurdistan – combined,” DNO’s Executive Chairman, Bijan Mossavar-Rahmani, commented.
At year end 2017, DNO’s CWI 1P reserves climbed to 240 million barrels of oil equivalent (MMboe) from 219 MMboe at year end 2016, after adjusting for production during the year, technical revisions and an increase in DNO’s operated stake in the Tawke licence from 55 percent to 75 percent under the terms of the August 2017 agreement. On a 2P basis, DNO’s CWI reserves stood at 384 MMboe (up from 368 MMboe) and on a 3P basis, DNO’s CWI reserves stood at 666 MMboe (up from 521 MMboe). DNO’s yearend 2017 CWI contingent resources (2C) were estimated at 99 MMboe, down from 161 MMboe at yearend 2016, following reclassification of certain contingent resources to reserves.
On a gross basis, at year end 2017, 1P reserves at the Tawke licence, containing the Tawke and Peshkabir fields, totalled 348 MMboe (353 MMboe at yearend 2016) after adjusting for production of 40 MMboe during the year and technical revisions; 2P reserves totalled 513 MMboe (536 MMboe at yearend 2016); 3P reserves totalled 880 MMboe (725 MMboe at yearend 2016) and 2C resources totaled 91 MMboe (211 MMboe at yearend 2016) following reclassification.
International petroleum consultants DeGolyer and MacNaughton carried out The annual independent assessment of the Tawke and Peshkabir fields was carried out by international petroleum consultants DeGolyer and MacNaughton, while DNO internally evaluated the remaining assets.
DeGolyer and MacNaughton Signe un Accord de cooperation avec SOCAR
novembre 9, 2017
DeGolyer and MacNaughton Signe un Accord de cooperation avec SOCAR
Amélioration de la performance et le développement des gisements d huile et de gaz azerbaïdjanais
Mrs John Wallace et Martin Wiewiorowski de D & M ont rencontré cette semaine Mr Rovnag Abdullayev, président de SOCAR, pour signer un accord visant à aider cette compagnie pétrolière et gazière publique, à améliorer l’efficacité des efforts de développement dans les champs pétroliers et gaziers du pays.
Selon un communiqué publié par le gouvernement azerbaïdjanais, D & M examinera les plans de développement de 20 champs et préparera des recommandations pour accroître la production et la récupération du pétrole, réduire les coûts de production pétrolière et définir des objectifs stratégiques à court terme. D & M participera également à la mise en œuvre de ces recommandations.
SOCAR announces Cooperative Agreement
D&M organise des séminaires et des séances d’information à l’intention des Dirigeants
août 9, 2017
D & M organise des séminaires et des briefings sur les réservoirs non conventionnels
Présentations axées sur la gestion des réservoirs et l’analyse du rendement des puits
En raison de leur nature unique, les actifs non conventionnels présentent des défis dans l’estimation des réserves et des ressources. Au cours des dix dernières années en Amérique du Nord, les sociétés pétrolières, les opérateurs et les banques ont financé le developpemnt des ressources non conventionnelles à un rythme remarquable. Pourtant, des questions liées à la projection et aux prévisions exactes des flux de trésorerie et de la production des puits reste en suspens. Bien que l industrie a progresse avec des puits latéraux longs et a niveaux multiples.
La Production à partir de ces ressources est, par nature, une fonction combinée des propriétés du réservoir et du fluide, de la géologie et des complétions, et par conséquent, la prévision de la production n’est pas un simple exercice d’ajustement de courbe.
Dans sa série Executive Briefing 2017 et sa série Unconventional Short Course,
DeGolyer and MacNaughton (D & M) a revise son approch pour répondre à ces questions ainsi que les problèmes associés à l’estimation des réserves et des ressources, comme le soulignent les lettres et pratiques récentes de la comission SEC. L’auditoire de plus de 150 cadres a été composé de clients de D & M et de non-clients et représentait plus de 60% de la valeur marchande de toutes les sociétés pétrolières et gazières en amont répertoriées en Amérique du Nord. De plus, de nombreuses sociétés privees, des entités de banque d’investissement et des sociétés nord-américaines et internationales de gestion de patrimoine et de capital prive, ainsi que des super-majors, étaient présents. Au cours des séances d’information, de nombreux points de vue ont été partagés lors des examens annuels indépendants de D & M portant sur plus de 40% des puits de ressources non conventionnelles en Amérique du Nord. La méthodologie de D & M pour évaluer les réservoirs non conventionnels a été partagée en détail, y compris la combinaison de D & M de diagnostic de production, d’analyse, d’analyse basée sur un modèle et de données de réservoir statique et completion .
« L’approche de D & M est unique, correcte et très opportune » –participants lors du Briefing exécutif des ressources non conventionnelles 2017
Les commentaires généraux des cadres présents à ces briefings ont été que «l’approche [ressources non conventionnelles] de D & M est unique [parmi ses pairs], correcte [techniquement] et très opportune.» En effet,
L’utilisation de l’approche de D & M est applicable quotidiennement Plutôt que purement pendant le cycle d’estimation des réserves.
Approche diagnostique est déjà utilisée par les ingénieurs de D & M pour examiner et estimer avec plus de précision les performances des puits de ressources non conventionnels. Les ingénieurs de D & M apportent un ensemble unique de connaissances à travers l’utilisation de cette approche cohérente. Il est prévu que des connaissances supplémentaires seront tirées de l’examen continu de ces puits, d’autant plus que les plans de completion sont affinés, évoluent et devraient établir de nouveaux repères économiques pour des formations particulières.
Le cours abrégé Unconventionnel : « Analyse de la performance du puits et prévisions dans les réserves non conventionnelles » a été assure par le DrDilhan Ilk, qui dirige les activités de conseil en ressources non conventionnelles de D & M. Dans ce cours, M. Ilk a passé en revue les fondements théoriques de la méthodologie utilisée pour analyser et prévoir la production. Des exemples de son application à partir de plays majeurs ont été examinés en détail, et des idées tirées du travail de D & M ont été présentées pour améliorer le travail continu des participants dans des ressources non conventionnelles.
L’une des technologies déployées par D & M pour apuyer son approche des ressources non conventionnelles est le module d’analyse de la production sur le gisement (Citrine) de Kappa Engineering. Qui a developpe Ce nouveau module en collaboration avec D & M et permet le chargement rapide et massif de donnees d origine publiques, des clients ou de simulation pour le traitement de données multipuits. Particulièrement adapté aux plays non conventionnels, Citrine utilise l’identification des tendances par visualisation et la comparaison multi-puits pour permettre aux utilisateurs de comprendre et d’interpréter pleinement les performances de gisement à l’aide de diagnostics et
D’analyse de courbe de déclin.
Cliquez ici pour en savoir plus.
En plus de l’événement informationnel du 28 août 2017 à Denver, D & M tiendra à l’avenir, d’autres séances d’information à l’intention des cadres supérieurs.
si vous souhaitez participer aux événements futurs.Dr. Dilhan Ilk, vice-président chez D & M, est une autorité de premier plan dans l’analyse de la performance des puits pour les réservoirs non conventionnels. Le présentateur principal pour chacune des réunions, Mr. Ilk dit que de nombreuses entreprises surestiment le potentiel des puits non conventionnels ou du moins ne regardent pas de façon réaliste le cycle de vie de la production.

Citrine Field Production Analysis
août 7, 2017
Kappa Engineering, en collaboration avec DeGolyer and MacNaughton , a publié un nouveau module qui permet le chargement rapide de donnees massives d origine publiques, de clients ou de simulation pour le traitement de données multipuits. Particulièrement adapté aux plays non conventionnels, Citrine utilise l’identification des tendances de visualisation et la comparaison multipuits pour permettre aux utilisateurs de comprendre et d’interpréter pleinement les performances sur le gisement à l’aide de diagnostics et d’analyse des courbes de déclin.