
Fervo Energy Secures Additional $255 Million Funding to Meet Unprecedented Energy Demand
十二月 19, 2024
Fervo Energy Secures Additional $255 Million Funding to Meet Unprecedented Energy Demand
HOUSTON, TX (December 19, 2024) – Fervo Energy (“Fervo”), the leader in next-generation geothermal development, today announced that it has secured $255 million in new funding and capital availability as it continues to build the world’s largest enhanced geothermal systems (“EGS”) power development. The announced funding comprises both opportunistic corporate equity and new debt financing.
Capricorn’s Technology Impact Fund II led the $135 million corporate equity round. Fervo is excited to welcome new investment and continued support from a suite of high-caliber investors, including Breakthrough Energy Ventures, CalSTRS, Congruent Ventures, CPP Investments, DCVC, Devon Energy, Galvanize Climate Solutions, Liberty Mutual Investments, Mercuria, and Sabanci Climate Ventures.
“The demand for 24/7 carbon-free energy is at an all-time high, and Fervo is one of the only companies building large projects that will come online before the end of the decade,” said Fervo CEO and Co-Founder Tim Latimer. “Investors recognize that Fervo’s ability to get to scale quickly is vital in an evolving market that is seeing unprecedented energy demand from AI and other sources.”
In addition to corporate equity, Fervo secured a $120 million letter of credit and term loan facility from Mercuria, one of the world’s largest independent energy and commodity groups. The facility will provide additional liquidity for Fervo to accelerate the deployment of EGS projects across the U.S. as it seeks to meet skyrocketing demand for clean, firm power.
“In surveying power markets across the U.S. today, the need for next-generation geothermal is undeniable,” said Brian Falik, Group Chief Investment Officer of Mercuria. “We believe in Fervo not just because their EGS approach is cost-effective, commercially viable, and already being deployed at scale, but because they set ambitious targets and consistently deliver.”
Fervo’s first greenfield development, Cape Station, is now fully permitted up to 2 GW and will begin generating electricity in 2026. This project is just a first step. As Fervo continues to meet and surpass its stated development milestones, expect additional exciting updates in the near future.
#
About Fervo Energy
Fervo Energy provides 24/7 carbon-free energy through the development of next-generation geothermal power. Fervo’s mission is to leverage innovation in geoscience to accelerate the world’s transition to sustainable energy. Geothermal has a major role to play in the future electric grid, and Fervo’s key advancements in drilling and subsurface analytics bring a full suite of modern technology to make geothermal cost-competitive and globally scalable. For more information, please visit www.fervoenergy.com.
Aramco, Linde and SLB sign shareholders’ agreement for one of the largest CCS hubs globally December 4, 2024
十二月 11, 2024
https://www.aramco.com/en/news-media/news/2024/aramco-linde-and-slb-sign-shareholders-agreement-for-one-of-the-largest-ccs-hubs-globally
- Aramco and its partners reach milestone in building phase one of CCS hub in Jubail, signaling positive progress on the Company’s 2035 interim climate ambitions
- First phase construction expected to be completed in 2027, with capacity to capture and store up to 9 million metric tons of CO2 per year
- Project supports Aramco’s ambition to achieve net-zero and Scope 2 gas emissions across its wholly-owned operated assets by 2050, and its interim target of reducing Upstream by 15% by 2035
- CCS hub also complements the Company’s blue hydrogen and ammonia program, and aligns with the Kingdom’s net-zero objectives
Aramco, one of the world’s leading integrated energy and chemicals companies, has signed a shareholders’ agreement with Linde and SLB, paving the way for development of a Carbon Capture and Storage (CCS) hub that is expected to become one of the largest globally. Under the terms of the shareholders’ agreement Aramco will take a 60% equity interest in the CCS hub, with Linde and SLB each owning a 20% stake.
It represents a significant milestone for the project and is a key component in Aramco’s emission mitigation strategy. With the support of the Ministry of Energy, phase one of the new CCS hub in Jubail, in the Kingdom of Saudi Arabia’s Eastern Province, is expected to capture and store up to nine million metric tons of CO2 annually, and construction is expected to be completed by the end of 2027. Later phases are expected to further expand its capacity.
The project will support the company’s ambition to achieve net-zero Scope 1 and gas emissions across its wholly-owned operated assets by 2050.
SOCAR Discusses Carbon Capture And Geothermal Opportunities With DeGolyer And MacNaughton November 28, 2024
十二月 11, 2024
SOCAR Discusses Carbon Capture And Geothermal Opportunities With DeGolyer And MacNaughton
U.S. company DeGolyer and MacNaughton met with the State Oil Company of Azerbaijan (SOCAR) representatives and discussed potential opportunities to work together on carbon capture and geothermal projects.
SOCAR and DeGolyer and MacNaughton have an already established partnership for field development and determining reserves and their meeting follows COP29 which was held in Baku.
DeGolyer and MacNaughton is an independent oil industry consultancy with a focus on resources assessments, reserves consulting, reservoir modeling, geologic and petrophysical analyses.
This is not SOCAR’s first foray into carbon capture. In September 2024 the company signed a number of MOU’s with Italian energy giant Eni, with one of them focused on greenhouse gas reduction and energy efficiency through carbon capture, utilization and storage.
Last year the company also signed an agreement to work together with Abu Dhabi energy company ADNOC on hydrogen, carbon capture and geothermal.
D&M provides independent Competent Person’s Report (CPR) for anticipated combination of Harbour Energy plc and Wintershall Dea on the London Stock Exchange
六月 19, 2024
Publication of Circular and Prospectus | Harbour Energy
Harbour Energy plc
(“Harbour” or the “Company”)
Publication of Circular and Prospectus in connection with proposed acquisition of Wintershall Dea
asset portfolio
12 June 2024
Harbour is pleased to announce that it has today, following receipt of approval from the Financial
Conduct Authority (the “FCA”), published its shareholder circular (the “Circular”) and prospectus (the
“Prospectus”) in relation to the proposed acquisition of substantially all of Wintershall Dea AG’s
upstreamoil and gas assets(the “Target Portfolio”) (the “Acquisition”). A general meeting of Harbour’s
shareholders has been scheduled for 5 July 2024 to consider and approve the Acquisition.
DeGolyer and MacNaughton (“D&M”) have prepared an independent competent person’s report
(“CPR”) on the Target Portfolio, which is included in full in the Prospectus. D&M has certified that, as
at 31 December 2023, the target portfolio had 1,117 mmboe1 of 2P oil and gas reserves with an
estimated value (NPV10) of $10.5 billion2
. This excludes c.60 mmboe of reserves produced between
the effective date of the Acquisition of 30 June 2023 and 31 December 2023. In addition, as at 31
December 2023, D&M has certified that the Target Portfolio had 1,238 mmboe of 2C contingent
resources3
.
The publication of the Circular and Prospectus marks another important milestone towards
completion of the Acquisition. In addition, all regulatory, anti-trust and foreign direct investment
approvals continue to progress as planned. These include approvalsfrom Egypt’s Ministry of Petroleum
and Mineral Resources and the European Commission, which were recently received. Harbour
continues to expect the Acquisition to complete during the fourth quarter of 2024.
Harbour has made available copies of the Circular and Prospectus as well as a presentation
summarising the key highlights of the Prospectus on its website at https://www.harbourenergy.com.
Gazprom Neft improves efficiency in developing the Priobskoye field together with D&M Corp
六月 1, 2018
Gazprom Neft has entered into an agreement with American corporation DeGolyer and MacNaughton Corp. on the selection and utilisation of innovative enhanced oil recovery (EOR) techniques at its Priobskoye field, in a document signed at this year’s St Petersburg International Economic Forum by Vadim Yakovlev, First Deputy CEO, Gazprom Neft, and Martin Wiewiorowski, Director of D&M’s Russian Branch.
Under this agreement DeGolyer and MacNaughton specialists will, throughout 2018–2020, analyse the history of the Priobskoye field since its discovery, assess the potential for increasing production and increasing the oil recovery factor (ORF), formulate recommendations for realising this potential, and address immediate challenges and problems in developing the Yuzhny (Southern) licence block at the Priobskoye field. On the basis of this data, plans for pilot works and further geological prospecting at the asset will be put in place.
In addition to this, the process of analysing the appropriate cutting-edge technologies to be used will be initiated, and alternative approaches to solving field development problems developed. A programme for the further professional development of Gazprom Neft specialists will also be put in place.
According to Gazprom Neft specialists, the full implementation of programmes developed under the agreement with D&M will allow reserves at the Priobskoye field to be brought into development, will enhance oil recovery through existing well stock, and will increase the ORF by five to six percent.
DeGolyer and MacNaughton plans to open an office in St Petersburg in 2018 in order to undertake implementation of this project.
Vadim Yakovlev, First Deputy CEO, Gazprom Neft, commented: Gazprom Neft has been working with DeGolyer and MacNaughton for more than 10 years. The unique competencies accumulated by the company during annual reserves audits has become a key component in our joint project to study the potential of the Priobskoye field, initiated in 2016. I have every confidence that this new agreement will allow our companies to further strengthen their cooperation and, ultimately, significantly improve efficiency in developing one of our largest production assets.”
http://www.gazprom-neft.com/press-center/news/1646776/
Gazprom Neft improves efficiency in developing the Priobskoye field together with D&M Corp
六月 1, 2018
As one of the leading independent consulting firm focused on the petroleum industry, DeGolyer and MacNaughton provides unbiased and informed answers to clients worldwide. D&M skilfully blends energy economics, engineering, and the earth sciences to help clients in more than 100 countries make the smartest decisions regarding exploration, recovery, and management of oil and gas resources.
The firm’s services include resources assessments, reserves consulting, reservoir modelling, geologic and petrophysical analyses, development planning, guidance with financial reporting issues, and financial forecasting for petroleum discoveries. DeGolyer and MacNaughton has the largest, most experienced team of professional reservoir consultants in the industry. D&M has built up extensive international experience in independent reserves assessments, the results of which are frequently used in certifying projects for presentation to financial institutions worldwide.
Gazprom Neft is a vertically integrated oil company, primarily involved in oil and gas exploration and production, refining, and the production and sale of oil products. The Gazprom Neft’s corporate structure comprises more than 70 production, refining and sales subsidiaries throughout Russia, the CIS, and abroad.
The company’s proved and probable reserves (SPE-PRMS) are estimated at 2.78 billion tonnes of oil equivalent (btoe), making Gazprom Neft one of the top-20 largest oil and gas companies in the world, and one of Russia’s top three largest companies in terms of production and refining volumes. Total production in 2017 reached 89.75 million tonnes of oil equivalent (mtoe), with refining volumes of 40.1 million tonnes.
Gazprom Neft products are exported to more than 50 countries worldwide, and sold throughout the Russian Federation and abroad. The company’s filling station network totals more than 1,850 outlets throughout Russia, the CIS and Europe.
Gazprom Neft’s net profit in 2017 was RUB253 billion — a 26.5-percent increase year-on-year. The company is an industry market leader in terms of both financial growth and various efficiency metrics, including its internal rate of return (IRR).
The company’s main shareholder is Gazprom PJSC, which has a 95.68-percent interest, with the remaining shares in free circulation.
DeGolyer & MacNaughton to study Priobskoye EOR
六月 1, 2018
Gazprom-Neft has entered an agreement with DeGolyer & MacNaughton Corp., Dallas, on the selection and use of enhanced oil recovery methods for giant Priobskoye field in the Khanti-Mansi Autonomous District of West Siberia.
The Russian company said DeGolyer & MacNaughton will “analyze the history of the Priobskoye since its discovery, assess the potential for increasing production and increasing the oil recovery factor, formulate recommendations for realizing this potential, and address the immediate challenges and problems in developing the Yuzhny (Southern) license block” of the field. The work will occur during 2018-20.
In an April 2016 announcement about production of the 100 millionth tonne of oil from Yuzhno-Priobskoye, Gazprom-Neft said the field, known to have complex geology, was producing 32,000 tonnes/day from 2,000 wells.
EOG Resources: Reports Fourth Quarter and Full 2017 Results
四月 13, 2018
“For the 30th consecutive year, internal reserves estimates were within 5 percent of estimates independently prepared by DeGolyer and MacNaughton.”
EOG Resources, Inc. (NYSE: EOG) (EOG) today reported fourth quarter 2017 net income of $2,430 million, or $4.20 per share. This compares to a fourth quarter 2016 net loss of $142 million, or $0.25 per share. For the full year 2017, EOG reported net income of $2,583 million, or $4.46 per share, compared to a net loss of $1,097 million, or $1.98 per share, for the full year 2016.
Adjusted non-GAAP net income for the fourth quarter 2017 was $401 million, or $0.69 per share, compared to an adjusted non-GAAP net loss of $7 million, or $0.01 per share, for the same prior year period. Adjusted non-GAAP net income for the full year 2017 was $648 million, or $1.12 per share, compared to an adjusted non-GAAP net loss of $893 million, or $1.61 per share, for the full year 2016. Adjusted non-GAAP net income (loss) is calculated by matching hedge realizations to settlement months and making certain other adjustments in order to exclude non-recurring and certain other items. One of the adjusting items in the fourth quarter and full year 2017 was a non-cash reduction in income tax expense of $2.2 billion, or $3.75 per share, related to the revaluation of EOG’s deferred tax liability and certain other items resulting from the Tax Cuts and Jobs Act. For a reconciliation of non-GAAP measures to GAAP measures, please refer to the attached tables.
Higher commodity prices, increased production volumes, well productivity improvements and per-unit cost reductions resulted in significant increases to adjusted non-GAAP net income, discretionary cash flow and EBITDAX for the fourth quarter 2017 compared to the fourth quarter 2016. For a reconciliation of non-GAAP measures to GAAP measures, please refer to the attached tables.
Operational Highlights
Crude oil and condensate volumes in the U.S. increased 20 percent in 2017 to 335,000 barrels of oil per day (Bopd). Increased development activity and well productivity improvements supported the volume increase. Total company natural gas liquids (NGLs) volumes grew 8 percent while natural gas volumes decreased 6 percent primarily due to the sale of the company’s Barnett and Haynesville Shale dry gas assets in late 2016. Transportation expenses decreased 11 percent and depreciation, depletion and amortization expenses decreased 12 percent, on a per-unit basis.
Increased development activity drove substantial volume increases in the Eagle Ford and Delaware Basin during the fourth quarter. Total company crude oil and condensate volumes increased 40,200 Bopd compared to the third quarter 2017. Natural gas liquids volumes grew 15 percent while natural gas volumes increased 6 percent, compared to the third quarter 2017.
“EOG emerged from the industry downturn in 2017 with unprecedented levels of efficiency and productivity, driving oil production volumes to record levels with capital expenditures approximately one half the prior peak,” said William R. “Bill” Thomas, Chairman and Chief Executive Officer. “EOG’s integrated teams demonstrated superb operational performance, overcoming a major hurricane and other challenges to deliver record production volumes and cost savings which surpassed original targets set at the beginning of the year.”
2018 Capital Plan
EOG’s disciplined capital plan is designed to achieve strong returns on capital employed and healthy growth while spending within cash flow. The company expects to grow total company crude oil volumes by 18 percent, generate double-digit ROCE and cover capital investment and dividend payments within discretionary cash flow. EOG can deliver on its 2018 plan at oil prices below $50 and generates significant free cash flow at a $60 oil price.
EOG’s return-based culture continues to drive cost reductions. The company targets lower well costs and per-unit operating expenses in 2018 despite a potentially inflationary operating environment. EOG is also focused on driving continued improvements in well productivity and pursuing exploration efforts in new plays.
Capital expenditures for 2018 are expected to range from $5.4 to $5.8 billion, including production facilities and gathering, processing and other expenditures, and excluding acquisitions. EOG expects to complete approximately 690 net wells in 2018, compared to 536 net wells in 2017. Capital will be allocated primarily to EOG’s highest rate-of-return oil assets in the Delaware Basin, Eagle Ford, Rockies, Woodford and the Bakken.
At least 90 percent of the wells completed in 2018 are expected to be premium. EOG has an inventory of approximately 8,000 such wells, which have a direct after-tax rate of return of at least 30 percent assuming $40 flat crude oil prices and $2.50 flat natural gas prices.
“EOG enters 2018 better positioned than ever to generate significant shareholder value through the development of its large and diverse inventory of high rate-of-return premium wells,” Thomas said. “We are determined to maintain the discipline, record-level operational efficiency and performance gained through the downturn. Our deep inventory of premium wells across the U.S. offers flexibility to adjust to changing conditions. We also see significant opportunities to increase our premium well inventory through organic exploration and development technology to further extend EOG’s return on capital advantage.”
Dividend Increase
The board of directors increased the cash dividend on the common stock by 10.4 percent. Effective with the dividend payable April 30, 2018, to stockholders of record as of April 16, 2018, the board declared a quarterly dividend of $0.185 per share on the common stock. The indicated annual rate is $0.74 per share.
Delaware Basin
2017 was a watershed year for EOG in the Delaware Basin, where it successfully integrated the Yates acquisition, identified 1,240 additional net premium well locations, added the First Bone Spring as its fourth premium play and reduced completed well costs by $800,000 per well. Delaware Basin crude oil and condensate volumes increased over 80 percent in 2017 and exceeded 100,000 Bopd in the fourth quarter 2017.
EOG continued active development of its 416,000 net acre position in the Delaware Basin in the fourth quarter 2017, completing 65 wells.
In the Delaware Basin Wolfcamp, in Lea County, NM, EOG completed a four-well package, the Calm Breeze 2 Fed Com #701-704H, with an average treated lateral length of 7,100 feet per well and average 30-day initial production rates per well of 2,605 Bopd, 440 barrels per day (Bpd) of NGLs and 3.7 million cubic feet per day (MMcfd) of natural gas.
In the Delaware Basin First Bone Spring, in Lea County, NM, EOG completed the Righteous 6 State Com #301H with a treated lateral length of 7,100 feet and 30-day initial production rate of 1,305 Bopd, 170 Bpd of NGLs and 1.4 MMcfd of natural gas.
In the Delaware Basin Leonard, in Loving County, TX, EOG completed a four-well package, the State Atlas A#3H – D#6H, with an average treated lateral length of 9,800 feet per well and average 30-day initial production rates per well of 1,215 Bopd, 270 Bpd of NGLs and 2.3 MMcfd of natural gas.
South Texas Eagle Ford and Austin Chalk
EOG continues to enhance the productivity of its bellwether asset in the South Texas Eagle Ford. Eight years after initiating development, EOG further reduced well costs and improved well performance during 2017 in its 520,000 net acre position in the crude oil window of this world class play. EOG also expanded its enhanced oil recovery program, adding 56 wells last year. For the full year 2017, crude oil production in the Eagle Ford and Austin Chalk increased one percent year-over-year despite interruption to producing volumes as a result of Hurricane Harvey.
In the fourth quarter, EOG completed 74 wells in the Eagle Ford. These included 13 wells with lateral lengths of more than 10,000 feet. In LaSalle County, EOG completed a four-well package, the White 5H-8H, with an average treated lateral length of 12,900 feet per well and average 30-day initial production rates per well of 1,545 Bopd, 80 Bpd of NGLs and 0.5 MMcfd of natural gas. In DeWitt County, EOG completed a four-well package, the Hendrix 8H-10H and the Hendrix 12H, with an average treated lateral length of 6,700 feet per well and average 30-day initial production rates per well of 2,545 Bopd, 420 Bpd of NGLs and 2.4 MMcfd of natural gas.
EOG continued to test its position in the South Texas Austin Chalk, a geologically complex formation which lies above the South Texas Eagle Ford, completing four net wells in the fourth quarter.
Rockies
EOG’s Wyoming Powder River Basin and DJ Basin activity both contributed to the company’s 2017 crude oil production growth. In the Powder River Basin, EOG continued exploration activity on its 400,000 net acre position in the core of the play. The company tested the prospectivity of multiple target zones and also tested the aerial extent of various targets in the Powder River Basin during the year. In the DJ Basin, EOG achieved significant well cost reductions during 2017 through a focus on efficiency improvements in drilling and completion operations.
In the fourth quarter, EOG completed nine wells in the Powder River Basin. In Converse County, EOG completed the Mary’s Draw 453-0310H and 455-0310H wells with an average treated lateral length of 7,300 feet per well and average 30-day initial production rates per well of 1,280 Bopd, 610 Bpd of NGLs and 7.6 MMcfd of natural gas. In the DJ Basin, EOG completed three wells in the fourth quarter. This included the Big Sandy 522-2536H with a treated lateral length of 8,800 feet and 30-day initial production rate of 1,100 Bopd, 110 Bpd of NGLs and 0.2 MMcfd of natural gas.
Reserves
At year-end 2017, total company net proved reserves were 2,527 million barrels of oil equivalent (MMBoe), an increase of 18 percent compared to year-end 2016. Net proved reserve additions from all sources, excluding revisions due to price, replaced 201 percent of EOG’s 2017 production at a finding and development cost of $8.71 per barrel of oil equivalent. Revisions due to price increased net proved reserves by 154 MMBoe and asset divestitures decreased net proved reserves by 21 MMBoe. (For more reserves detail and a reconciliation of non-GAAP measures to GAAP measures, please refer to the attached tables.)
For the 30th consecutive year, internal reserves estimates were within 5 percent of estimates independently prepared by DeGolyer and MacNaughton.
Hedging Activity
During the fourth quarter ended December 31, 2017, EOG entered into crude oil financial price swap contracts and differential basis swap contracts. A comprehensive summary of crude oil and natural gas derivative contracts is provided in the attached tables.
Capital Structure and Asset Sales
At December 31, 2017, EOG’s total debt outstanding was $6.4 billion with a debt-to-total capitalization ratio of 28 percent. Considering cash on the balance sheet at the end of the fourth quarter, EOG’s net debt was $5.6 billion with a net debt-to-total capitalization ratio of 25 percent. For a reconciliation of non-GAAP measures to GAAP measures, please refer to the attached tables.
Proceeds from asset sales for the full year 2017 totaled $227 million.
Conference Call February 28, 2018
EOG’s fourth quarter and full year 2017 results conference call will be available via live audio webcast at 8 a.m. Central time (9 a.m. Eastern time) on Wednesday, February 28, 2018. To access the live audio webcast and related presentation materials, log on to the Investors Overview page on the EOG website at http://investors.eogresources.com/overview.
EOG Resources, Inc. is one of the largest independent (non-integrated) crude oil and natural gas companies in the United States with proved reserves in the United States, Trinidad, the United Kingdom and China. EOG Resources, Inc. is listed on the New York Stock Exchange and is traded under the ticker symbol “EOG.” For additional information about EOG, please visit www.eogresources.com.
This press release includes forward-looking statements within the meaning of Section 27A of the Securities Act of 1933, as amended, and Section 21E of the Securities Exchange Act of 1934, as amended. All statements, other than statements of historical facts, including, among others, statements and projections regarding EOG’s future financial position, operations, performance, business strategy, returns, budgets, reserves, levels of production, costs and asset sales, statements regarding future commodity prices and statements regarding the plans and objectives of EOG’s management for future operations, are forward-looking statements. EOG typically uses words such as “expect,” “anticipate,” “estimate,” “project,” “strategy,” “intend,” “plan,” “target,” “goal,” “may,” “will,” “should” and “believe” or the negative of those terms or other variations or comparable terminology to identify its forward-looking statements. In particular, statements, express or implied, concerning EOG’s future operating results and returns or EOG’s ability to replace or increase reserves, increase production, reduce or otherwise control operating and capital costs, generate income or cash flows or pay dividends are forward-looking statements. Forward-looking statements are not guarantees of performance. Although EOG believes the expectations reflected in its forward-looking statements are reasonable and are based on reasonable assumptions, no assurance can be given that these assumptions are accurate or that any of these expectations will be achieved (in full or at all) or will prove to have been correct. Moreover, EOG’s forward-looking statements may be affected by known, unknown or currently unforeseen risks, events or circumstances that may be outside EOG’s control. Furthermore, EOG has presented or referenced herein or in its accompanying disclosures certain forward-looking, non-GAAP financial measures, such as free cash flow and discretionary cash flow, and certain related estimates regarding future performance, results and financial position. These forward-looking measures and estimates are intended to be illustrative only and are not intended to reflect the results that EOG will necessarily achieve for the period(s) presented. EOG’s actual results may differ materially from the measure and estimates presented or referenced herein. Important factors that could cause EOG’s actual results to differ materially from the expectations reflected in EOG’s forward-looking statements include, among others:
- the timing, extent and duration of changes in prices for, supplies of, and demand for, crude oil and condensate, natural gas liquids, natural gas and related commodities;
- the extent to which EOG is successful in its efforts to acquire or discover additional reserves;
- the extent to which EOG is successful in its efforts to economically develop its acreage in, produce reserves and achieve anticipated production levels from, and maximize reserve recovery from, its existing and future crude oil and natural gas exploration and development projects;
- the extent to which EOG is successful in its efforts to market its crude oil and condensate, natural gas liquids, natural gas and related commodity production;
- the availability, proximity and capacity of, and costs associated with, appropriate gathering, processing, compression, transportation and refining facilities;
- the availability, cost, terms and timing of issuance or execution of, and competition for, mineral licenses and leases and governmental and other permits and rights-of-way, and EOG’s ability to retain mineral licenses and leases;
- the impact of, and changes in, government policies, laws and regulations, including tax laws and regulations; environmental, health and safety laws and regulations relating to air emissions, disposal of produced water, drilling fluids and other wastes, hydraulic fracturing and access to and use of water; laws and regulations imposing conditions or restrictions on drilling and completion operations and on the transportation of crude oil and natural gas; laws and regulations with respect to derivatives and hedging activities; and laws and regulations with respect to the import and export of crude oil, natural gas and related commodities;
- EOG’s ability to effectively integrate acquired crude oil and natural gas properties into its operations, fully identify existing and potential problems with respect to such properties and accurately estimate reserves, production and costs with respect to such properties;
- the extent to which EOG’s third-party-operated crude oil and natural gas properties are operated successfully and economically;
- competition in the oil and gas exploration and production industry for the acquisition of licenses, leases and properties, employees and other personnel, facilities, equipment, materials and services;
- the availability and cost of employees and other personnel, facilities, equipment, materials (such as water) and services;
- the accuracy of reserve estimates, which by their nature involve the exercise of professional judgment and may therefore be imprecise;
- weather, including its impact on crude oil and natural gas demand, and weather-related delays in drilling and in the installation and operation (by EOG or third parties) of production, gathering, processing, refining, compression and transportation facilities;
- the ability of EOG’s customers and other contractual counterparties to satisfy their obligations to EOG and, related thereto, to access the credit and capital markets to obtain financing needed to satisfy their obligations to EOG;
- EOG’s ability to access the commercial paper market and other credit and capital markets to obtain financing on terms it deems acceptable, if at all, and to otherwise satisfy its capital expenditure requirements;
- the extent to which EOG is successful in its completion of planned asset dispositions;
- the extent and effect of any hedging activities engaged in by EOG;
- the timing and extent of changes in foreign currency exchange rates, interest rates, inflation rates, global and domestic financial market conditions and global and domestic general economic conditions;
- political conditions and developments around the world (such as political instability and armed conflict), including in the areas in which EOG operates;
- the use of competing energy sources and the development of alternative energy sources;
- the extent to which EOG incurs uninsured losses and liabilities or losses and liabilities in excess of its insurance coverage;
- acts of war and terrorism and responses to these acts;
- physical, electronic and cyber security breaches; and
- the other factors described under ITEM 1A, Risk Factors, on pages 14 through 23 of EOG’s Annual Report on Form 10-K for the fiscal year ended December 31, 2017, and any updates to those factors set forth in EOG’s subsequent Quarterly Reports on Form 10-Q or Current Reports on Form 8-K.
In light of these risks, uncertainties and assumptions, the events anticipated by EOG’s forward-looking statements may not occur, and, if any of such events do, we may not have anticipated the timing of their occurrence or the duration and extent of their impact on our actual results. Accordingly, you should not place any undue reliance on any of EOG’s forward-looking statements. EOG’s forward-looking statements speak only as of the date made, and EOG undertakes no obligation, other than as required by applicable law, to update or revise its forward-looking statements, whether as a result of new information, subsequent events, anticipated or unanticipated circumstances or otherwise.
The United States Securities and Exchange Commission (SEC) permits oil and gas companies, in their filings with the SEC, to disclose not only “proved” reserves (i.e., quantities of oil and gas that are estimated to be recoverable with a high degree of confidence), but also “probable” reserves (i.e., quantities of oil and gas that are as likely as not to be recovered) as well as “possible” reserves (i.e., additional quantities of oil and gas that might be recovered, but with a lower probability than probable reserves). Statements of reserves are only estimates and may not correspond to the ultimate quantities of oil and gas recovered. Any reserve estimates provided in this press release that are not specifically designated as being estimates of proved reserves may include “potential” reserves and/or other estimated reserves not necessarily calculated in accordance with, or contemplated by, the SEC’s latest reserve reporting guidelines. Investors are urged to consider closely the disclosure in EOG’s Annual Report on Form 10-K for the fiscal year ended December 31, 2017, available from EOG at P.O. Box 4362, Houston, Texas 77210-4362 (Attn: Investor Relations). You can also obtain this report from the SEC by calling 1-800-SEC-0330 or from the SEC’s website at www.sec.gov. In addition, reconciliation and calculation schedules for non-GAAP financial measures can be found on the EOG website at www.eogresources.com.
DNO ASA 2017 Annual Statement of Reserves and Resources
三月 16, 2018
DNO ASA, the Norwegian oil and gas operator, today released its 2017 Annual Report and Accounts together with its 2017 Annual Statement of Reserves and Resources, reporting an increase in operating profit and improvements across other key financial and operational metrics.
Founded in 1971 and listed on the Oslo Stock Exchange with the code DNO. OL, the company holds stakes in onshore and offshore licences at various stages of exploration, development and production in the Kurdistan region of Iraq, Yemen, Oman, the United Arab Emirates, Tunisia and Somaliland. Its largest shareholder is UAE-based RAK Petroleum.
Annual 2017 revenues climbed to US$ 347 million, up 72 percent from the 2016 figures, the company said. Operating profit totalled US$ 521 million, up from US$ 6 million in 2016, with the recognition as other income of US$ 556 million under the August 2017 Kurdistan Receivables Settlement Agreement. Excluding the settlement agreement and non-cash impairments, DNO operating profit in 2017 more than doubled to US$ 72 million. Although operational expenditure last year reached US$ 259 million, double the 2016 figure, the company ended 2017 with a cash balance of USD 430 million.
Company Working Interest, CWI, production increased to 73,700 barrels of oil equivalent per day (boepd) from 69,200 boepd in 2016. Total production from DNO-operated fields, including those in which other companies have stakes, rose to 113,500 boepd in 2017, up from 112,600 boepd in 2016. Lifting costs last year averaged US$ 3.6 per barrel of oil equivalent.
DNO’s production continues to be driven by the Tawke field in Kurdistan, where output in 2017 averaged 105,500 barrels of oil per day (bopd). The adjacent Peshkabir field, brought on stream in the middle of 2017, contributed another 3,600 bopd to bring total Tawke licence production to 109,100 bopd for the year. DNO plans to boost production from this licence area in 2018 by drilling ten new wells, the report said.
“We are committed this year (2018) to continue to outdrill, outproduce and outperform all other international companies in Kurdistan – combined,” DNO’s Executive Chairman, Bijan Mossavar-Rahmani, commented.
At year end 2017, DNO’s CWI 1P reserves climbed to 240 million barrels of oil equivalent (MMboe) from 219 MMboe at year end 2016, after adjusting for production during the year, technical revisions and an increase in DNO’s operated stake in the Tawke licence from 55 percent to 75 percent under the terms of the August 2017 agreement. On a 2P basis, DNO’s CWI reserves stood at 384 MMboe (up from 368 MMboe) and on a 3P basis, DNO’s CWI reserves stood at 666 MMboe (up from 521 MMboe). DNO’s yearend 2017 CWI contingent resources (2C) were estimated at 99 MMboe, down from 161 MMboe at yearend 2016, following reclassification of certain contingent resources to reserves.
On a gross basis, at year end 2017, 1P reserves at the Tawke licence, containing the Tawke and Peshkabir fields, totalled 348 MMboe (353 MMboe at yearend 2016) after adjusting for production of 40 MMboe during the year and technical revisions; 2P reserves totalled 513 MMboe (536 MMboe at yearend 2016); 3P reserves totalled 880 MMboe (725 MMboe at yearend 2016) and 2C resources totaled 91 MMboe (211 MMboe at yearend 2016) following reclassification.
International petroleum consultants DeGolyer and MacNaughton carried out The annual independent assessment of the Tawke and Peshkabir fields was carried out by international petroleum consultants DeGolyer and MacNaughton, while DNO internally evaluated the remaining assets.
The Outdoor Classroom Seminar: Integrated Reservoir Appraisal and Reservoir Modeling
二月 23, 2018
What you will learn: Through this immersive field-based seminar, students will improve their understanding of modeling and their abilities to model geological features affecting reservoir performance through the collection, observation, interpretation, and modeling of geologic, petrophysical, and engineering data. Seminar instructors will present methods for collecting, analyzing, and interpretating data to most efficiently appraise reservoir size and characteristics. Over the course of the seminar, students will visit outcrops that reveal the complex but interpretable geologic features that influence reservoir development. These outcrop observations, along with wireline log data, petrophysical data collected from nearby boreholes, will be incorporated into the geocellular models that must be developed and simulated during the 5-day course.
Who Should Attend: This course is designed for petroleum engineers, geologists, geophysicists, petrophysicists, and supervisory personnel responsible for executing field-development programs focused on primary, secondary, or tertiary-recovery projects in conventional terrigineous-clastic reservoirs. The geologic and engineering concepts and practices introduced in the seminar are applicable to reservoirs spanning all depositional settings.
See Brochure Link for more details! Integrated Reservoir Appraisal and Development Seminar Final
Costs: TBD per person and includes:
- 5 day seminar
- Field guide and exercise materials
- Transportation during seminar
- Lunch, snacks, and drinks during the seminar
Additional costs (responsibility of attendees)
- Transportation to and from Salt Lake City, Utah on May 6, returning May 12.
- Meals other than lunch during the five-day course
- Hotel costs
Gazprom Neft: Reserves Replacement at 170%
二月 22, 2018
Gazprom Neft has completed auditing of the company’s hydrocarbon reserves as at 2017. As at 31 December 2017 the company’s total proved and probable hydrocarbon reserves (proved + probable — 2P based on SPE-PRMS international standards,* including proportional shares in production at joint enterprises**) totalled 2.78 billion tonnes of oil equivalent (toe) — a year-on-year increase of 2.3 percent. Production volumes in 2017, at 89.75 mtoe, were compensated by reserves replacement in the order of 170 percent. The audit was undertaken by independent international consulting company DeGolyer and MacNaughton.
Proved 1P hydrocarbons as at end 2017 are estimated at 1.52 btoe — an increase of 0.6 percent, year-on-year. The reserve replacement ratio for this category of reserves is 110 percent Gazprom Neft’s reserves-to-production ratio in terms of proved hydrocarbon reserves (SPE-PRMS standards) is 17 years. According to SEC standards,*** the company’s total hydrocarbon reserves stand at 1.34 mtoe (an increase of 3.4 percent over 2017).
Drilling of 27 prospecting and exploratory wells was completed in this accounting period, with drilling meterage in 2017 increasing by 41.2 percent (to 94,600 metres). Four new wells and 42 hydrocarbon deposits were discovered last year throughout the group’s licence blocks.
A key positive factor in allowing the company to expand its resources base has been the fine-tuning of technologies in geological prospecting and development drilling, together with the implementation of dynamic ranking for all company options. Gazprom Neft’s new assets — including the Tazovskoye, Severo-Samburgskoye and Kamennomysskoye fields — have all made a major contribution to expanding the company’s resource base.
An assessment of prospective resources at Gazprom Neft’s licence blocks on the Arctic Shelf was undertaken for the first time in 2017, with DeGolyer and MacNaughton estimating these at 1.6 billion tonnes of oil and three trillion cubic metres of gas.
Vadim Yakovlev, First Deputy CEO, Gazprom Neft, commented: «Gazprom Neft last year continued its consistent development of its upstream projects, as well as undertaking work on accessing new licence blocks. Major discoveries were confirmed, which have made the company’s resource base still more balanced and high-quality. The company’s priority development vectors continue to include improving quality in the development of new reserves, active work in studying low-permeability strata, and implementing a programme for improving efficiency in production in those regions in which the company has traditionally operated.»
Abraxas Provides Reserve and Operational Update
二月 20, 2018
SAN ANTONIO–(BUSINESS WIRE)–Abraxas Petroleum Corporation (“Abraxas” or the “Company”) (NASDAQ:AXAS) today provided the following reserve and operational update. Highlights include:
- Total proved reserves as of December 31, 2017 of 65.9 MMBoe up 21.2 MMBoe or 47.5%
- Proved developed producing (“PDP”) reserves grew 48.5% to 20.7 MMBoe
- PV-10 (1) of $425.9 million using SEC 12-month average pricing of $51.34/bbl and $2.99/mcf natural gas
- 2017 reserve replacement ratio of 887%
- 2017 PDP finding and development (“PDP F&D”) cost of $10.42/Boe
- In the Delaware Basin, Abraxas booked 17 gross Wolfcamp A1, 17 gross Wolfcamp A2, two gross Wolfcamp B and two gross Third Bone Spring proved undeveloped locations across four gross sections at Caprito (1320 foot spacing assumed)
- In the Delaware Basin, Abraxas booked an additional eight gross Third Bone Spring, Wolfcamp A1 and Wolfcamp A2 proved undeveloped locations across four additional gross sections
- Potential downspacing and the remainder of Abraxas’ leasehold in the Delaware Basin remains unbooked for future years
- In Ward County, Texas, the Caprito 82-101, a 4,820 foot lateral and the Company’s first Third Bone Spring well, averaged 1,122 Boepd (878 barrels of oil per day, 1,463 mcf of natural gas per day)(2) over the well’s first 30 days of production
- In Ward County, Texas, the Caprito 82-202, a 4,820 foot lateral targeting the Wolfcamp A1, averaged 1,134 Boepd (863 barrels of oil per day, 1,626 mcf of natural gas per day)(2) over the well’s first 30 days of production
https://www.businesswire.com/news/home/20180220005422/en/Abraxas-Reserve-Operational-Update
December 31, 2017 Reserves
As of December 31, 2017, Abraxas’ proved oil and natural gas reserves consisted of approximately 65.9 MMBoe, a net increase of 21.2 MMBoe or 47.5% over 2016 year-end reserves of 44.7 MMBoe. December 31, 2017 reserves consisted of approximately 37.6 million barrels of oil, 12.0 million barrels of NGLs and 97.8 billion cubic feet of natural gas. PDP reserves were 20.7 MMBoe an increase of 48.5% over 2016 PDP reserves and comprised 31.4% of proved reserves as of December 31, 2017.
The SEC-priced pre-tax PV-10 (1) (a non-GAAP financial measure) was $425.9 million, using 2017 average prices of $51.34/bbl of oil and $2.99/mcf of natural gas. Realized pricing, including differentials, used in this calculation equated to $46.82/bbl of oil and $1.79/mcf of natural gas.
Net proved reserve additions of 23.9 MMBoe resulted in a reserve replacement ratio of 887% (defined as the sum of extensions, discoveries, revisions and purchases, divided by annual production). PDP F&D cost (defined as total drilling and completion capital expenditures divided by total PDP reserve additions) was $10.42/Boe.
The majority of Abraxas’ reserve additions came from the Delaware Basin, where Abraxas booked 17 gross Wolfcamp A1, 17 gross Wolfcamp A2, two gross Wolfcamp B and two gross Third Bone Spring proved undeveloped locations across four gross sections at Caprito (1320 foot spacing assumed). Abraxas booked an additional eight gross Third Bone Spring, Wolfcamp A1 and Wolfcamp A2 proved undeveloped locations across four additional gross sections. The remainder of Abraxas’ leasehold in the Delaware Basin remains entirely unbooked for future years. Abraxas also sold 1.3 MMBoe of reserves during 2017.
The independent reserve engineering firm DeGolyer and MacNaughton prepared a complete engineering analysis on 98.5% of Abraxas’ proved reserves on a Boe basis.
The following table outlines changes in Abraxas’ proved reserves from December 31, 2016:
| Oil
(MMbbl) |
Natural Gas
(Bcf) |
NGL
(MMbbl) |
Total
(MMBoe) |
||||||||||||||
| Proved Reserves December 31, 2016 | 24.2 |
70.8 |
8.6 | 44.7 | |||||||||||||
| Additions | 14.5 | 14.5 | 2.8 | 19.8 | |||||||||||||
| Purchases | 0.0 | 1.0 | 0.0 | 0.2 | |||||||||||||
| Revisions | 0.8 | 19.3 | 1.3 | 5.3 | |||||||||||||
| Sales | (0.4 | ) | (4.0 | ) | (0.3 | ) | (1.3 | ) | |||||||||
| Production | (1.6 | ) | (3.9 | ) | (0.5 | ) | (2.7 | ) | |||||||||
| Proved Reserves December 31, 2017 | 37.6 | 97.8 | 12.0 | 65.9 | |||||||||||||
Fourth Quarter and Year End 2017 Production and CAPEX Update
Production for the fourth quarter of 2017 averaged approximately 8,788 Boepd (5,325 barrels of oil per day, 12,334 mcf of natural gas per day, 1,407 barrels of NGL per day). Production for the year ending December 31, 2017 averaged approximately 7,391 Boepd (4,311 barrels of oil per day, 10,655 mcf of natural gas per day, 1,304 barrels of NGL per day).
Capital expenditures for the year ended December 31, 2017 are expected to be approximately $135 million ($132 million cash and $3 million stock issuance). Approximately $31 million of the capital expenditures were spent on acquisitions with the remainder spent on drilling, completion and facilities.
Operations Update
In Ward County, Texas, the Caprito 82-101H, a 4,820 foot lateral and the Company’s first Third Bone Spring test, averaged 1,122 Boepd (878 barrels of oil per day, 1,463 mcf of natural gas per day)(2) over the well’s first 30 days of production. The Caprito 82-202H, a 4,820 foot lateral targeting the Wolfcamp A1 zone, averaged 1,134 Boepd (863 barrels of oil per day, 1,626 mcf of natural gas per day)(2) over the well’s first 30 days of production. Abraxas owns a 100% and 57.1% working interest in the Caprito 82-101H and 82-202H, respectively.
Bob Watson, President and CEO of Abraxas, commented, “We are pleased to report our sixth consecutive year of production and reserve growth. 2018 promises to be a continuation of this trend with substantial upside left to be booked in the Delaware Basin and current production rates that are 50% higher than our 2017 average production. Our focused inventory of highly economic development locations in the Bakken and Wolfcamp/Bone Spring position us to drive multiple-years of high-return production and reserve growth for our shareholders.
“We are also pleased to announce another highly productive zone on our Ward County acreage in the Third Bone Spring. This represents the fourth zone we have derisked in Ward County. We are currently testing downspacing on our acreage. The results of this will dictate the optimal development of these four zones on our acreage. Importantly, very little of this potential or downspacing is currently booked as proved undeveloped reserves, which bodes well for future reserve growth.”
(1) The following table provides a reconciliation of PV-10 to the standardized measure of discounted future net cash flows at December 31, 2016 and 2017:
| December 31, | ||||||||||
| (in thousands) | 2016 | 2017 | ||||||||
| PV-10 | $ | 160,600 | $ | 425,936 | ||||||
| Estimated present value of future income taxes discounted at 10% | — |
(32,448 |
) |
|||||||
| Standardized measure of discounted future net cash flows | $ | 160,600 | $ |
393,488 |
||||||
(2) The 30-day average rates represent the highest 30 days of production and do not include the impact of natural gas liquids and shrinkage at the processing plant and include flared gas.
Abraxas Petroleum Corporation is a San Antonio based crude oil and natural gas exploration and production company with operations in the Williston Basin, Permian Basin and South Texas regions of the United States.
Safe Harbor for forward-looking statements: Statements in this release looking forward in time involve known and unknown risks and uncertainties, which may cause Abraxas’ actual results in future periods to be materially different from any future performance suggested in this release. Such factors may include, but may not be necessarily limited to, changes in the prices received by Abraxas for crude oil and natural gas. In addition, Abraxas’ future crude oil and natural gas production is highly dependent upon Abraxas’ level of success in acquiring or finding additional reserves. Further, Abraxas operates in an industry sector where the value of securities is highly volatile and may be influenced by economic and other factors beyond Abraxas’ control. In the context of forward-looking information provided for in this release, reference is made to the discussion of risk factors detailed in Abraxas’ filings with the Securities and Exchange Commission during the past 12 months.
Contacts
Abraxas Petroleum Corporation
Geoffrey King, 210-490-4788
Vice President – Chief Financial Officer
gking@abraxaspetroleum.com
www.abraxaspetroleum.com
Ecopetrol Group increases its hydrocarbon reserves, proven reserves mount to 1,659 million barrels-equivalent at 2017 close
二月 19, 2018
https://www.prnewswire.com/news-releases/ecopetrol-group-increases-its-hydrocarbon-reserves-proven-reserves-mount-to-1659-million-barrels-equivalent-at-2017-close-300600891.html
BOGOTÁ, Colombia, Feb. 19, 2018 /PRNewswire/ — Ecopetrol (BVC: ECOPETROL; NYSE: EC) today announced its proven reserves of oil, condensate and natural gas (1P reserves), including its share in affiliates and subsidiaries, as of December 31, 2017.
Reserves were estimated based on US Securities and Exchange Commission (SEC) standards and methodologies. 99% of the reserves were audited by two well-known, independent, specialized firms (Ryder Scott Company and Degolyer and MacNaughton).
At the 2017 close, the Ecopetrol Group’s net proven reserves were 1,659 million barrels of oil-equivalent. The reserve replacement index was 126%, with average reserve life equivalent to 7.1 years.
95% of the proven reserves are owned by Ecopetrol S.A., while Hocol, Ecopetrol America and the Equión and Savia Perú interests contributed 5%. Ecopetrol S.A. has an average reserve life of 7.4 years.
In 2017, the Ecopetrol Group incorporated 295 million barrels of oil-equivalent of proven reserves, representing a positive change in the reserves incorporation trend in recent years. The year’s total accumulated production was 234 million barrels of oil-equivalent.
The SEC price used for valuation of the 2017 reserves was USD 54.93 per Brent barrel, versus USD 44.49 per Brent barrel in 2016. Ecopetrol estimates that 94 million barrels of oil equivalent were recovered as a result of the higher price effect due to the extension of the fields’ economic limit and the incorporation of new projects. It is further estimated that the company’s technical management and financial optimization of assets contributed 201 million barrels of oil equivalent.
We note that much of the increase in proven reserves (73 MBOE) is due to the results of the Recovery Factor Increase program, the principal gains of which occurred in fields such as Chichimene, Castilla, Casabe and Tibú. This result is very satisfactory, as it is one of the pillars of the company’s growth in reserves and production.
|
Ecopetrol Group Proven Reserves 2015 – 2017 |
|||
|
2015 |
2016 |
2017 |
|
|
Proven |
2.084 |
1.849 |
1.598 |
|
Revisions |
-25 |
-54 |
175 |
|
Enhanced Recovery |
16 |
11 |
73 |
|
Mineral Purchases |
0 |
0 |
4 |
|
Extensions and discoveries |
24 |
27 |
44 |
|
Sales |
0.0 |
0.0 |
0.0 |
|
Production |
-251 |
-235 |
-234 |
|
Net proven reserves Dec 17 |
1.849 |
1.598 |
1.659 |
Bogotá D.C., February 19, 2018
————————————–
This release contains statements that may be considered forward looking statements within the meaning of Section 27A of the U.S. Securities Act of 1933 and Section 21E of the U.S. Securities Exchange Act of 1934. All forward-looking statements, whether made in this release or in future filings or press releases or orally, address matters that involve risks and uncertainties, including in respect of the Company’s prospects for growth and its ongoing access to capital to fund the Company’s business plan, among others. Consequently, changes in the following factors, among others, could cause actual results to differ materially from those included in the forward-looking statements: market prices of oil & gas, our exploration and production activities, market conditions, applicable regulations, the exchange rate, the Company’s competitiveness and the performance of Colombia’s economy and industry, to mention a few. We do not intend, and do not assume any obligation to update these forward-looking statements.
For further information contact:
Capital Markets Manager
María Catalina Escobar
Telephone: +571-234-5190
Email: investors@ecopetrol.com.co
Media Relations (Colombia)
Jorge Mauricio Tellez
Telephone: +571-234-4329
Email: mauricio.tellez@ecopetrol.com.co
SOURCE Ecopetrol S.A.
Antero Resources (AR) Announces 12% Increase in Estimated Proved Reserves to 17.3 Tcfe
二月 14, 2018
Antero Resources (NYSE: AR) (“Antero” or the “Company”) today announced estimated reserves as of December 31, 2017.
Highlights:
- Proved reserves increased by 12% to 17.3 Tcfe at year-end 2017 (36% liquids), compared to year-end 2016
- Pre-tax PV-10 of proved reserves at year-end 2017 was $10.8 billion at SEC pricing, including hedges
- Proved developed reserves increased by 23% to 8.5 Tcfe at year-end 2017, compared to year-end 2016
- $0.54 per Mcfe proved developed finding and development cost for 2017
- $0.37 per Mcfe future development cost for year-end 2017 proved undeveloped reserves
- 3P reserves increased by 18% to 54.6 Tcfe at year-end 2017 (25% liquids), compared to year-end 2016
- Pre-tax PV-10 of 3P reserves at year-end 2017 was $18.4 billion at SEC pricing, including hedges
Antero’s estimated proved reserves at December 31, 2017 were 17.3 Tcfe, a 12% increase compared to estimated proved reserves at December 31, 2016. Proved, probable and possible (“3P”) reserves at year-end 2017 totaled 54.6 Tcfe, which represents an 18% increase compared to the previous year. For further discussion of 3P reserves, please read “Non-GAAP Disclosure.”
Proved developed finding and development (“F&D”) cost for estimated proved developed reserve additions was $0.54 per Mcfe for 2017. All-in F&D cost for estimated proved reserve additions, including acquisitions, was $0.59 per Mcfe for 2017. Future development costs for proved undeveloped locations are estimated to be $0.37 per Mcfe. The reserve life of the Company’s estimated proved reserves is approximately 21 years based on 2017 production. For further discussion of all-in F&D cost and proved developed F&D cost, please read “Non-GAAP Disclosure.” Antero’s estimated proved and 3P reserves at December 31, 2017 were prepared by its internal reserve engineers and audited by DeGolyer and MacNaughton (“D&M”). D&M’s reserve audit covered properties representing 100% of Antero’s total 3P reserves at December 31, 2017.
Estimated Proved Reserves
As of December 31, 2017, the Company’s 17.3 Tcfe of estimated proved reserves were comprised of 64% natural gas, 35% NGLs and 1% oil. The Marcellus Shale accounted for 90% of estimated proved reserves and the Ohio Utica Shale accounted for 10%. For 2017, Antero added 1.7 Tcfe of estimated proved reserves organically, excluding acquisitions, which is reflective of the continued productivity gains from the use of advanced completion techniques and longer laterals.
All 381 proved undeveloped locations in the Marcellus at year-end 2017 were booked at an approximate 2 Bcf/1,000′ type curve. This compares to year-end 2016 at which time 81 proved undeveloped locations, or 21% of the total proved undeveloped locations in the Marcellus, were booked at the approximate 2 Bcf/1,000′ type curve. The primary driver behind the increase in the number of proved undeveloped locations booked at the higher approximate 2 Bcf/1,000′ type curve type curve is the increased production history observed from the implementation of advanced completions techniques.
Estimated proved developed reserves increased by 23% from year-end 2016 to 8.5 Tcfe at December 31, 2017. The percentage of estimated proved reserves classified as proved developed increased to 49% at December 31, 2017 from 45% at year-end 2016. The average heating content of Antero’s proved undeveloped locations is 1237 BTU, and the average lateral length is approximately 10,500 feet.
Under the Securities and Exchange Commission (“SEC”) reporting rules, proved undeveloped reserves are limited to reserves that are planned to be developed within five years of initial booking. The Company reclassified 2,778 Bcfe of formerly non-proved reserves to proved undeveloped due to their addition to Antero’s five-year development plan. Included in this reclassification was the revision of 286 Bcfe related to an improvement in performance from advanced completions and a 291 Bcfe revision related to a lateral extension of previously booked locations. Additionally, the Company reclassified 2,280 Bcfe of generally lower BTU proved undeveloped reserves to the probable category in 2017 to comply with the SEC five-year development rule. Antero’s 8.8 Tcfe of estimated proved undeveloped reserves will require an estimated $3.3 billion of future development capital over the next five years, resulting in an estimated average future development cost for proved undeveloped reserves of $0.37 per Mcfe.
Antero incurred estimated capital costs of approximately $1.7 billion during 2017, including drilling and completion costs of $1.282 billion, proved property acquisitions of $176 million and leasehold additions of $204 million. Based on the $1.7 billion of capital costs, 2017 all-in F&D cost for proved reserve additions from all sources, including acquisitions and revisions, was $0.59 per Mcfe.
|
Summary of Changes in Estimated Proved Reserves (in Bcfe) |
||
|
Balance at December 31, 2016 |
15,386 |
|
|
Extensions, discoveries and additions |
1,711 |
|
|
Purchases of estimated proved reserves |
373 |
|
|
Revisions to prior estimates |
726 |
|
|
Ethane recovery revision |
(113) |
|
|
Production |
(822) |
|
|
Balance at December 31, 2017 |
17,261 |
|
The table below summarizes both SEC and strip pricing as of December 31, 2017 and the associated PV-10 for estimated proved reserves and hedge values:
|
2017 Year-End |
|||||||
|
Benchmark Pricing: |
SEC Pricing |
Strip Pricing(1) |
Variance |
% Variance |
|||
|
WTI Oil Price ($/Bbl) |
$51.03 |
$53.44 |
$2.41 |
5% |
|||
|
Appalachian Oil Price ($/Bbl)(2) |
$45.35 |
$47.70 |
$2.35 |
5% |
|||
|
Nymex Natural Gas Price ($/MMBtu) |
$3.11 |
$2.93 |
$(0.18) |
(6)% |
|||
|
Appalachian Natural Gas Price ($/MMBtu)(2) |
$2.91 |
$2.63 |
$(0.28) |
(10)% |
|||
|
C3+ Natural Gas Liquids ($/Bbl) (3) |
$32.37 |
$32.23 |
$(0.14) |
0% |
|||
|
C2+ Natural Gas Liquids ($/Bbl)(3) |
$20.40 |
$20.62 |
$0.22 |
1% |
|||
|
Pre-Tax PV-10 Values ($Bn): |
|||||||
|
Estimated proved reserves PV-10 |
$10.2 |
$9.1 |
$(1.1) |
(11)% |
|||
|
Hedge PV-10 (4) |
0.6 |
1.2 |
0.6 |
100% |
|||
|
Total PV-10 |
$10.8 |
$10.3 |
$(0.5) |
(5)% |
|||
|
1) |
Strip pricing as of December 31, 2017 for each of the first ten years and flat thereafter. |
|||||||||||||||||||||||||||||||||||||||||||||||||||||||||||||||||||||||||||||||||||||||||||||||||||||||||||||||||||||||||||||||||||||||||||||||||||||||||||||||||||||||||||||||||||||||||||||||||||||||||||||||||||||||||||||||||||||||||||||||||||||||||||||||||||||||||||||||||||||||||||||||||||||||||||||||||||||||||||||||||||||||||||||||||||||||||||||||||||||||||||||||||||||||||||||||||||||||||||||||||||||||||||||||||||||||||||||||||||||||||||||||||||||||||||||||||||||||||||||||||||||||||||||||||||||||||||||||||||||||||||||||||||||||||||||||||||||||||||||
|
2) |
Represents SEC and strip prices as of December 31, 2017 on a weighted average Appalachian index basis related to company-specific sales points.
Proved, Probable and Possible Reserves Antero estimates that it had year-end 2017 3P reserves of 54.6 Tcfe, an 18% increase from year-end 2016. The 18% increase in 3P reserves was driven by a combination of increased type curves in certain areas driven by continued productivity gains from advanced completions, as well as 2017 leasehold acquisitions. As of December 31, 2017, the Company’s 54.6 Tcfe of 3P reserves were comprised of 75% natural gas, 23% NGLs and 2% oil. The Marcellus and Ohio Utica Shale comprised 48.3 Tcfe and 6.4 Tcfe of the 3P reserves, respectively. Virtually no Upper Devonian or West Virginia Utica reserves were included in 3P reserves. Importantly, 46.2 Tcfe of Antero’s 48.3 Tcfe, or 96% of estimated Marcellus 3P reserves were classified as proved and probable reserves (“2P”), reflecting the low risk and statistically repeatable nature of Antero’s resource base. The 46.2 Tcfe of Marcellus 2P reserves includes 381 proved undeveloped and 460 probable locations, or 26% of the total undeveloped 2P reserve locations in the Marcellus that were booked at the approximate 2 Bcf/1,000′ type curve. This compares to year-end 2016 where 81 proved undeveloped and 7 probable locations, or just 3% of the total undeveloped 2P reserve locations in the Marcellus were booked at the approximate 2 Bcf/1,000′ type curve. The increase in upgraded 2P locations is primarily driven by continued productivity gains from implementing advanced completions techniques across a larger subset of Antero’s acreage position. Further, 6.2 Tcfe of Antero’s 6.4 Tcfe, or 97% of estimated 3P reserves in the Ohio Utica were classified as 2P. The tables below summarize Antero’s estimated 3P reserve volumes as of December 31, 2017 using SEC pricing, categorized by operating area as well as PV-10 values of Antero’s 3P reserve volumes using both SEC and strip pricing. For further discussion of 3P reserves, please read “Non-GAAP Disclosure.”
Non-GAAP Disclosure Certain selected financial information in this release is unaudited. Additional unaudited financial information will be provided in Antero’s Annual Report on Form 10-K for the year ended December 31, 2017, which the Company filed with the SEC on February 13, 2018. In this release, Antero has provided a number of unaudited metrics, which include all-in F&D cost per unit and proved developed F&D cost per unit. These non-GAAP metrics are commonly used in the exploration and production industry by companies, investors and analysts in order to measure a company’s ability of adding and developing reserves at a reasonable cost. The F&D costs per unit are statistical indicators that have limitations, including their predictive and comparative value. In addition, because the F&D costs per unit do not consider the cost or timing of future production of new reserves, such measures may not be adequate measures of value creation. These reserve metrics may not be comparable to similarly titled measurements used by other companies. There are no directly comparable financial measures presented in accordance with GAAP for all-in F&D cost per unit and proved developed F&D cost per unit, and therefore a reconciliation to GAAP is not practicable. Calculations for all-in and proved developed F&D cost per unit are based on costs incurred in 2017. The calculations for both all-in and proved developed F&D cost per unit do not include future development costs required for the development of proved undeveloped reserves. Pre-tax PV–10 values and pre-tax PV-10 values including hedges are non-GAAP financial measures as defined by the SEC. Antero believes that the presentation of these pre-tax PV–10 values are relevant and useful to its investors because it presents the discounted future net cash flows attributable to reserves and hedges prior to taking into account corporate future income taxes and the Company’s current tax structure. The Company further believes investors and creditors use pre-tax PV-10 values as a basis for comparison of the relative size and value of its reserves and hedges as compared with other companies. Antero believes that PV–10 estimates using strip pricing and including hedges can be used within the industry and by creditors and securities analysts to evaluate estimated net cash flows in the current commodity price environment. PV–10 estimates using strip pricing are not adjusted for the likelihood that the pricing scenario will occur, and thus they may not be comparable to PV–10 value using SEC pricing. The GAAP financial measure most directly comparable to pre-tax PV–10 is the standardized measure of discounted future net cash flows (“Standardized Measure”). The following sets forth the estimated future net cash flows from our proved reserves (without giving effect to our commodity derivatives), the present value of those net cash flows before income tax (PV-10) and the present value of those net cash flows after income tax (Standardized measure) at December 31, 2017:
Notwithstanding their use for comparative purposes, the Company’s non-GAAP financial measures may not be comparable to similarly titled measures employed by other companies. Antero has provided summations of its proved, probable and possible reserves and summations of its PV-10 for its proved, probable and possible reserves in this press release. The SEC strictly prohibits companies from aggregating proved, probable and possible reserves in filings with the SEC due to the different levels of certainty associated with each reserve category. Investors should be cautioned that estimates of PV-10 of probable reserves, as well as underlying volumetric estimates, are inherently more uncertain of being recovered and realized than comparable measures for proved reserves, and that the uncertainty for possible reserves is even more significant. Further, because estimates of probable and possible reserve volumes have not been adjusted for risk due to this uncertainty of recovery, their summation may be of limited use. |
|||||||||||||||||||||||||||||||||||||||||||||||||||||||||||||||||||||||||||||||||||||||||||||||||||||||||||||||||||||||||||||||||||||||||||||||||||||||||||||||||||||||||||||||||||||||||||||||||||||||||||||||||||||||||||||||||||||||||||||||||||||||||||||||||||||||||||||||||||||||||||||||||||||||||||||||||||||||||||||||||||||||||||||||||||||||||||||||||||||||||||||||||||||||||||||||||||||||||||||||||||||||||||||||||||||||||||||||||||||||||||||||||||||||||||||||||||||||||||||||||||||||||||||||||||||||||||||||||||||||||||||||||||||||||||||||||||||||||||||
Valeura Announces Prospective Resources for Unconventional Basin-Centered Gas Prospect
二月 7, 2018
CALGARY, Feb. 6, 2018 /CNW/ – Valeura Energy Inc. (“Valeura” or the “Corporation“) (TSX: VLE) is pleased to announce summary results of an independent evaluation of its prospective resources in the Thrace Basin of Turkey prepared by DeGolyer and MacNaughton (“D&M“) of Dallas, Texas in its report dated February 6, 2018 (the “D&M Resources Report“). Highlights of the D&M Resources Report are as follows:
- 10.1 Tcf of estimated working interest unrisked mean prospective resources of natural gas, which includes 236 MMbbl of condensate; and
- 5.2 Tcf of estimated working interest risked mean prospective resources of natural gas, which includes 165 MMbbl of condensate.
Valeura’s CEO, Sean Guest, said “We are pleased to now have an independent evaluation that supports Valeura’s thesis that the Thrace Basin may hold a very large unconventional, basin-centered natural gas-condensate resource. Valeura has been maturing this play for almost five years and these efforts culminated in the drilling of the Yamalik-1 natural gas-condensate discovery in 2017 with our partner Statoil. While Valeura is confident that natural gas is pervasive in these deep formations, we recognise that we are in the early phases of exploration. More drilling and testing will be required to prove that the gas will flow at commercial rates, and to refine the large uncertainty around recoverable gas and condensate. Valeura and Statoil are committed to progressing the work required to further evaluate this unconventional prospect. We are currently working to tie-in the Yamalik-1 discovery well to Valeura’s gas production network to allow for further testing and long-term production and sales. Additionally, Statoil and Valeura are planning a three-well delineation drilling and testing program which is expected to commence in Q3 2018.”
2017 YEAR-END UNCONVENTIONAL PROSPECTIVE RESOURCES SUMMARY
The D&M Resources Report was prepared using the guidelines outlined in the Canadian Oil and Gas Evaluation Handbook (“COGEH“) and in accordance with NI 51-101 and is valid at December 31, 2017. D&M evaluated the unconventional prospective resources attributable to the Teslimkoy/Kesan basin-centered gas prospect on Valeura’s lands in the Thrace Basin of Turkey. The working interest lands included comprise the deep formations (generally below 2,500 m depth) on the Corporation’s Banarli licenses (50% working interest), TBNG JV West Thrace lands (31.5% working interest), and TBNG JV South Thrace lands (81.5% working interest).
The D&M evaluation benefited from the Yamalik-1 natural gas-condensate discovery, which was recently drilled and tested on the Banarli licenses. Yamalik-1 discovered an approximate 1,300 m column of natural gas and condensate in over-pressured reservoirs below 2,900 m in the Teslimkoy and Kesan formations. The well was drilled to 4,196 m, fracture stimulated and production tested in Q4 2017. As announced on December 27, 2017, four production tests from eight frac stages in the Kesan formation yielded a 24-hour aggregate test rate of 2.9 MMcf/d. Extensive coring and wireline logging information was also captured in the well.
Yamalik-1 was the first well to be extensively facture stimulated in the basin-centered gas prospect in the Thrace Basin. However, well data from seven other legacy wells drilled in the prospective area to depths up to 4,050 m also indicate over-pressured natural gas below approximately 2,500 m and were available for D&M’s evaluation. Only one of these legacy wells (Yayli-1) was fracture stimulated with a small two-stage frac at a depth of approximately 2,800 m.
Table 1 below summarizes D&M’s estimates of Valeura’s working interest prospective natural gas resources (defined as “conventional natural gas” under NI 51-101). These numbers as reported by D&M are for the complete gas stream and explicitly include condensate resources (defined as “natural gas liquids” under NI 51-101) which are entrained in the natural gas. Sales gas volumes would be nominally lower than those presented in Table 1. Table 2 shows the amount of condensate that would be recovered associated with the production of the natural gas volumes shown in Table 1.
Table 1 Valeura Working Interest Natural Gas Prospective Resources at December 31, 2017(6)(7)(8)(9)(10)
|
Valeura Working |
Unrisked |
Chance of % (11) |
Risked Mean Estimate (12) |
|||
|
Low Estimate (2) |
Best Estimate (3) |
High Estimate (4) |
Mean Estimate (5) |
|||
|
Conventional Natural Gas (13) – Bcf |
||||||
|
Total |
3,229 |
7,652 |
20,077 |
10,137 |
51.1 |
5,182 |
The broad range of recoverable gas from 3.2 to more than 20 Tcf is a function of the uncertainty in the various components of the assessment including recovery factor. There has been very limited stimulation and production testing from the over-pressured Teslimkoy and Kesan formations in the Thrace Basin, and as yet there is no production data. To determine potential recovery factors, D&M have utilized their experience in analogous basins. The prospective resources in Table 1 and 2 assume a low recovery factor estimate of approximately 25%, a best and mean estimate of 40% and high estimate of 55%. Significantly more delineation drilling, stimulation, and testing will be required to confirm that gas can be commercially recovered from the prospect, and to generate type curves that can be used in a predictive sense. All of Valeura’s prospective resources were sub-classified into the project maturity subclass of ‘prospect’.
Table 2 Valeura Working Interest Natural Gas Liquids Prospective Resources at December 31, 2017(6)(7)(8)(9)(10)
|
Valeura Working |
Unrisked |
|||
|
Low Estimate (2) |
Best Estimate (3) |
High Estimate (4) |
Mean Estimate (5) |
|
|
Condensate (Natural Gas Liquids) (14) – MMbbl |
||||
|
Total |
45 |
155 |
504 |
236 |
D&M has assigned a chance of discovery of 70%. This high chance is driven by: (1) the hundreds of legacy wells drilled in the Thrace Basin which support the geological model for the Teslimkoy and Kesan formations; (2) the over-pressured natural gas which was encountered and tested at Yamalik-1, and (3) the seven legacy wells surrounding the basin which all encountered over-pressured gas below 2,500 m.
D&M has assigned a chance of development of the natural gas prospective resources of approximately 74%, which is a product of the probability of threshold economic field size and probability of development. This high chance of development reflects that existing hydraulic fracturing technology is being applied, well depths and costs are not expected to be excessive, sales pipeline infrastructure already exists in the area and there are ready domestic markets in Turkey for domestic natural gas and condensate sales. This results in an overall chance of commerciality of 51.1% which is the product of chance of discovery and chance of development. The resulting risked mean estimates of conventional natural gas prospective resources are shown in Table 1, as risked for chance of commerciality.
Understanding of the extent of this basin-centered gas prospect in the Thrace Basin and its potential commerciality is in the early stages of exploration and appraisal. There are a number of positive and negative factors which are driving large uncertainty. The key positive factors include:
- Design work is underway for the production facilities and gathering pipeline to tie-in the Yamalik-1 well to Valeura’s existing gathering sales pipeline infrastructure to enable a long-term production test and natural gas and condensate sales from the well at an anticipated cost of approximately US$3 MM (gross). First sales from Yamalik-1 are targeted for Q2 2018.
- Valeura and Statoil are planning a delineation drilling program comprising three wells expected to commence in Q3 2018 and extend into 2019. The first well in this program will be the second and final earning well under Phase 3 of the Banarli Farm-in to be fully funded by Statoil.
- The follow-up delineation drilling program will benefit from the new Karaca 3D seismic in terms of finalizing drilling locations, correlating the seismic to the Yamalik-1 well results and targeting sweet-spots in the basin-centered gas prospect.
- It is expected that the follow-up delineation wells will be drilled to approximately 5,000 m given good potential to extend the column of hydrocarbon-bearing sands. The Yamalik-1 well was drilled to 4,196 m, the limit of the rig capability and well completion, but the base of the well was still in gas-bearing sands that were successfully flow tested.
- Valeura’s existing infrastructure and customer base is expected to be capable of handling sales of more than 35 MMcf/d compared to current sales through the system of less than 10 MMcf/d, thereby providing the opportunity for early production from any future delineation wells.
- Turkey is a captive natural gas market given that 99% of its natural gas demand is served by imports. This provides an attractive marketing opportunity for a domestic natural gas producer. As Valeura’s natural gas production volumes potentially grow beyond the limit of its owned infrastructure, there are multiple take-away opportunities. These include: a potential to tie-in to a pipeline owned by Bori Hatlari ile Petrol Tasima Anonim Sirketi (“BOTAS“) just north of the Banarli lands; a tie-in to another BOTAS interconnector pipeline traversing Banarli and connected to an export line to Greece; and sales to the local gas distributor who currently offtakes gas from the BOTAS pipeline to the north.
- Natural gas prices in Turkey are strong. Valeura’s average natural gas price realization in Q4 2017 was approximately CAD$6.61/Mcf. On January 1, 2018, the reference natural gas price set by BOTAS was increased by 14%.
Negative factors with respect to the estimate of prospective resources include:
- The basin-centered gas prospect is in the early exploration and delineation cycle with very sparse well control and very limited fracture stimulation and testing data.
- There is no long-term well production performance from the basin-centered prospect to establish a production type curve specific to the prospect, thereby requiring use of analogue information at this time to establish development plans and to confirm the chance of commerciality.
- Recovery efficiencies are uncertain given the absence of site specific long-term well production performance data in the basin-centered gas prospect.
- The limited deep drilling carried out in the Thrace Basin provides poor visibility on future costs to drill, frac and complete deep development wells to exploit the basin-centered gas prospect and the associated impact on the chance of commerciality.
- Although oil and gas activity has been underway for many decades in the Thrace Basin area, as activity levels increase, timelines may increase to achieve government and local landowner approvals.
RESERVES UPDATE
For completeness, the Corporation also announces an update on its proved plus probable (2P) gross reserves attributed to its properties in the Thrace Basin of Turkey. The Corporation has completed an internal assessment (non-independent) which estimates 2P gross reserves of 7.8 MMboe effective December 31, 2017. This represents a significant increase in reserves relative to the reported year-end 2016 and is attributed to the TBNG acquisition which occurred after the year-end 2016 report. The Corporation expects that the related 2P net present value of future net revenue before-tax for year-end 2017 will be similar to year-end 2016 as the increase in reserves from the TBNG acquisition is expected to be mostly offset by a reduction in the forecast gas price.
D&M are currently preparing their independent evaluation of the Corporation’s reserves at December 31, 2017. This information will be released in the normal course in March 2018 in conjunction with the release of the 2017 Annual Information Form.
ABOUT THE CORPORATION
Valeura Energy Inc. is a Canada-based public company currently engaged in the exploration, development and production of petroleum and natural gas in Turkey.
OIL AND GAS ADVISORIES
When used herein, the term “boe” means barrels of oil equivalent on the basis of one boe being equal to one barrel of oil or natural gas liquids, or 6.0 Mcf of natural gas. Barrel of oil equivalent may be misleading, particularly if used in isolation. A boe conversion ratio of 6.0 Mcf to 1.0 bbl is based on an energy equivalency conversion method primarily applicable at the burner tip and does not represent a value equivalency at the wellhead.
The prospective resources and reserves estimates provided herein are estimates only and there is no guarantee that the estimated reserves and prospective resources will be recovered.
RESERVES AND RESOURCES DEFINITIONS
“Chance of Discovery” is the estimated probability that exploration activities will confirm the existence of a significant accumulation of potentially recoverable petroleum.
“Chance of Development” is the estimated probability that, once discovered, a known accumulation will be commercially developed.
“Company gross reserves” are the Company’s working interest (operating or non-operating) share before deducting royalties and without including any royalty interests of the Company.
”Condensate” is defined as Natural Gas Liquids product type as per NI 51-101.
“Natural Gas” is defined as Conventional Natural Gas product type as per NI 51-101
“Proved” or “1P” reserves are those reserves that can be estimated with a high degree of certainty to be recoverable. It is likely that the actual remaining quantities recovered will exceed the estimated proved reserves.
“Probable” reserves are those additional reserves that are less certain to be recovered than proved reserves. It is equally likely that the actual remaining quantities recovered will be greater or less than the sum of the estimated proved plus probable (“2P“) reserves.
“Prospective Resources” are those quantities of petroleum estimated, as of a given date, to be potentially recoverable from undiscovered accumulations by application of future development projects. Prospective resources have both an associated chance of discovery and a chance of development.
”Reserves” are estimated remaining quantities of oil and natural gas and related substances anticipated to be recoverable from known accumulations, from a given date forward, based on: (a) analysis of drilling, geological, geophysical, and engineering data; (b) the use of established technology; and (c) specified economic conditions, which are generally accepted as being reasonable and shall be disclosed. Reserves are classified according to the degree of certainty associated with the estimates.
FOOTNOTES TO TABLES
|
(1) |
Valeura’s working interest in the lands (exploration licences and production leases) that are encompassed (all or a portion thereof) in the basin-centered gas prospect in the Teslimkoy/Kesan formation is as follows: Banarli 50%, West Thrace 31.5% and South Thrace 81.5%. |
|
(2) |
The low estimate is the P90 quantity. P90 means there is a 90% chance that the estimated quantity will be equaled or exceeded. |
|
(3) |
The best estimate is the P50 quantity. P50 means there is a 50% chance that the estimated quantity will be equaled or exceeded. |
|
(4) |
The high estimate is the P10 quantity. P10 means there is a 1 % chance that the estimated quantity will be equaled or exceeded. |
|
(5) |
The mean estimate is the probability-weighted average (expected value). |
|
(6) |
The totals are the arithmetic summation of probabilistic estimates. Arithmetic summation may produce invalid results except for the mean. |
|
(7) |
Unconventional prospective resources, as prepared by D&M, are those quantities of petroleum that are estimated, at a given date, to be potentially recoverable from undiscovered unconventional accumulations by application of future development projects. Unconventional prospective resources may exist in petroleum accumulations that are pervasive throughout a large potential production area and would not be significantly affected by hydrodynamic influences (also called continuous-type deposits). Typically such accumulations (once discovered) require specialized extraction technology (e.g. massive fracturing programs for tight gas). Tight gas occurs within low permeability reservoir rocks, which are rocks with matrix porosity of 10 percent or less and permeability of 0.1 millidarcies or less, exclusive of fractures. Tight gas can be regionally distributed (e.g. the basin-centered gas prospect in the Thrace Basin evaluated herein), rather than accumulated in a readily producible reservoir in a discrete structural closure as in a conventional gas field. |
|
(8) |
Prospective resources have both an associated chance of discovery and a chance of development. There is no certainty that any portion of the unconventional prospective resources estimated herein will be discovered. If discovered, there is no certainty that it will be commercially viable to produce any portion of the unconventional prospective resources evaluated. Estimates of the unconventional prospective resources should be regarded only as estimates that may change as additional information becomes available. Not only are such unconventional prospective resources estimates based on that information which is currently available, but such estimates are also subject to uncertainties inherent in the application of judgmental factors in interpreting such information. Unconventional prospective resources should not be confused with those quantities that are associated with contingent resources or reserves due to the additional risks involved. Because of the uncertainty of commerciality and the lack of sufficient exploration drilling, the unconventional prospective resources estimated herein cannot be classified as contingent resources or reserves. The quantities that might actually be recovered, should they be discovered and developed, may differ significantly from the estimates herein. |
|
(9) |
The unconventional prospective resources estimates contained in the D&M Resources Report are expressed as gross and working interest unconventional prospective resources. Table 1 and 2 summarizes Valeura’s working interest unconventional prospective resources, which incorporate the fraction of potential hydrocarbon pore volume owned or partially owned by Valeura and Valeura’s working interest ownership, before deduction of any associated royalty burdens. Recovery efficiency is applied to unconventional prospective resources in Table 1 and 2. |
|
(10) |
The estimation of resources quantities for a prospect is subject to both technical and commercial uncertainties and, in general, may be quoted as a range. The range of uncertainty reflects a reasonable range of estimated potentially recoverable quantities. Estimates of petroleum resources herein are expressed using the terms low estimate, best estimate, high estimate and mean estimate (unrisked and risked) to reflect the range of uncertainty. |
|
(11) |
The chance of commerciality is defined as the product of the chance of discovery and the chance of development. Chance of discovery is defined in COGEH as the estimated probability that exploration activities will confirm the existence of a significant accumulation of potentially recoverable petroleum. Chance of development is the estimated probability that, once discovered, a known accumulation will be commercially developed. |
|
Chance of discovery in the D&M Resources Report is referred to as the probability of geologic success (Pg), which is defined as the probability of discovering reservoirs that flow hydrocarbons at a measureable rate. The Pg is estimated by quantifying with a probability, each of the following geologic chance factors: trap, source, reservoir and migration. The product of the probabilities of these four chance factors is Pg. Pg is predicated and correlated to the minimum case prospective resources gross recoverable volume(s). Consequently, the Pg is not linked to economically viable volumes, economic flow rates or economic field size distributions. |
|
|
In the D&M Resources Report, two factors have been considered in determining the chance of development as follows: |
|
|
Chance of development = Ptefs (probability of threshold economic field size) x Pd (probability of development) |
|
|
D&M defines Ptefs as the probability of discovering an accumulation that is large enough to be economically viable. Ptefs is estimated by using the prospective resources potential recoverable quantities distribution in conjunction with the threshold economic field size (TEFS). TEFS is the minimum amount of the producible petroleum required to recover the total capital and operating expenditure used to establish the potential accumulation as having a potential present worth at 10% equal to zero using the most likely price scenario. |
|
|
D&M defines Pd as the probability that a given discovery will be a viable development project. It takes into account the chance that the discovered target zone will flow the predicted hydrocarbon phase(s) at a commercial rate. It also considers the chance that the target zone can be mechanically completed and appraised in a reasonable time and in compliance with the projected cost schedule. The Pd is estimated by the quantification and product of these two chance factors. |
|
|
(12) |
The risked mean estimate of conventional natural gas prospective resources = the unrisked mean estimate x chance of discovery x chance of development. |
|
(13) |
The risked mean estimate of natural gas liquids prospective resources = the Unrisked mean estimate x chance of discovery. |
|
(14) |
The natural gas liquids prospective resources are included in the conventional natural gas prospective resources. |
ABBREVIATIONS
|
Bcf |
billion cubic feet |
|
bbl |
barrels |
|
boe |
barrels of oil equivalent |
|
m |
metres |
|
M |
thousand |
|
MM |
million |
|
MMcf/d |
million cubic feet per day |
|
Tcf |
trillion cubic feet |
ADVISORY AND CAUTION REGARDING FORWARD-LOOKING INFORMATION
This news release contains certain forward-looking statements and information (collectively referred to herein as “forward-looking information“) including, but not limited to: the anticipated delineation drilling and development program to exploit the basin-centered gas prospect on Valeura’s working interest lands; the plans, timelines and cost to tie-in the Yamalik-1 well to conduct a long term production test, establish production type curves and achieve gas sales; completion of Phase 3 of the Banarli Farm-in and drilling of the second earning well to be funded by Statoil; the ability to target sweet spots in the basin-centered gas prospect; the plans to drill to 5,000m in the basin-centered gas prospect delineation program and the cost and timeline impacts; the capacity of Valeura’s existing infrastructure in the Thrace Basin and ability to handle up to 35 MMcf/d; the ability to access other pipeline systems in the Thrace Basin should future production volumes exceed the capacity of Valeura’s existing infrastructure; the anticipated conventional tight gas development program in the Tekirdag field that underpins the Corporation’s current probable and possible reserves; the preparation and timing of the 2017 D&M Reserves Report; and the ability to finance future developments. Forward-looking information typically contains statements with words such as “anticipate”, estimate”, “expect”, “target”, “potential”, “could”, “should”, “would” or similar words suggesting future outcomes. The Corporation cautions readers and prospective investors in the Corporation’s securities to not place undue reliance on forward-looking information, as by its nature, it is based on current expectations regarding future events that involve a number of assumptions, inherent risks and uncertainties, which could cause actual results to differ materially from those anticipated by the Corporation.
Statements related to “reserves” or “prospective resources” are deemed forward-looking statements as they involve the implied assessment, based on certain estimates and assumptions, that the reserves and prospective resources can be profitably produced in the future. Specifically, forward-looking information contained herein regarding “reserves” and “prospective resources” may include: estimated volumes and value of Valeura’s oil and gas reserves; estimated volumes of prospective resources and the ability to finance future development; and, the conversion of a portion of prospective resources into reserves.
Forward-looking information is based on management’s current expectations and assumptions regarding, among other things: political stability of the areas in which the Corporation is operating and completing transactions, and in particular the aftermath of the July 2016 failed coup attempt in Turkey and April 2017 constitutional referendum; continued safety of operations and ability to proceed in a timely manner; continued operations of and approvals forthcoming from the Turkish government in a manner consistent with past conduct; future seismic and drilling activity on the expected timelines; the prospectivity of the TBNG JV lands and Banarli licences, including the deep basin-centered gas potential; the continued favourable pricing and operating netbacks in Turkey; future production rates and associated operating netbacks and cash flow; future sources of funding; future economic conditions; future currency exchange rates; the ability to meet drilling deadlines and other requirements under licences and leases; and the Corporation’s continued ability to obtain and retain qualified staff and equipment in a timely and cost efficient manner. In addition, the Corporation’s work programs and budgets are in part based upon expected agreement among joint venture partners and associated exploration, development and marketing plans and anticipated costs and sales prices, which are subject to change based on, among other things, the actual results of drilling and related activity, availability of drilling, fracing and other specialized oilfield equipment and service providers, changes in partners’ plans and unexpected delays and changes in market conditions. Although the Corporation believes the expectations and assumptions reflected in such forward-looking information are reasonable, they may prove to be incorrect.
Forward-looking information involves significant known and unknown risks and uncertainties. Exploration, appraisal, and development of oil and natural gas reserves are speculative activities and involve a significant degree of risk. A number of factors could cause actual results to differ materially from those anticipated by the Corporation including, but not limited to: the risks of currency fluctuations; changes in gas prices and netbacks in Turkey; uncertainty regarding the contemplated timelines for the Yamalik-1 tie-in program; completion of the Banarli Farm-in program and the basin-centered gas delineation drilling program; the risks of disruption to operations and access to worksites, threats to security and safety of personnel and potential property damage related to political issues, terrorist attacks, insurgencies or civil unrest in Turkey; political stability in Turkey, including potential changes in Turkey’s constitution, political leaders or parties or a resurgence of a coup or other political turmoil; the uncertainty regarding government and other approvals; counterparty risk; potential changes in laws and regulations; and risks associated with weather delays and natural disasters; the risk associated with international activity; and, the uncertainty regarding the ability to fulfill the drilling commitment on the West Thrace lands. The forward-looking information included in this news release is expressly qualified in its entirety by this cautionary statement. The forward-looking information included herein is made as of the date hereof and Valeura assumes no obligation to update or revise any forward-looking information to reflect new events or circumstances, except as required by law. See Valeura’s 2016 AIF for a detailed discussion of the risk factors.
Additional information relating to Valeura is also available on SEDAR at www.sedar.com
Neither the Toronto Stock Exchange nor its Regulation Services Provider (as that term is defined in the policies of the Toronto Stock Exchange) accepts responsibility for the adequacy or accuracy of this news release.
SOURCE Valeura Energy Inc.
Maurel & Prom: -2017 sales: $400m (up 14%)
二月 6, 2018
Paris, 5 February 2018
No. 02-18
2017 sales: $400m (up 14%)
- Group sales up 14% to $400m for 2017
- Increase in the average sale price of oil: up 24% compared to 2016
- Higher demand for gas in Tanzania: annual production up 13%
- Group reserves at 31 December 2017 in M&P share :
- Gross P1+P2 reserves: 215 MMboe
- P1+P2 reserves net of royalties: 195 MMboe
2017 Sales
| Q1 2017 | Q2 2017 | Q3 2017 | Q4 2017 | 12 months 2017 | 12 months 2016 | Chg.17/16 | |||
| Total production sold over the period, M&P share | |||||||||
| millions of barrels of oil | 1.6 | 1.7 | 1.8 | 1.7 | 6.8 | 7.4 | -8% | ||
| million MMBTU | 1.9 | 1.4 | 2.7 | 2.8 | 8.8 | 7.8 | +13% | ||
| Average sale price | |||||||||
| OIL, in $/bbl | 52.8 | 48.6 | 50.0 | 59.7 | 53.0 | 42.7 | 24% | ||
| GAS, in $/BTU | 3.18 | 3.22 | 3.13 | 3.12 | 3.15 | 3.13 | 1% | ||
| EUR/USD exchange rate | 1.06 | 1.10 | 1.17 | 1.18 | 1.13 | 1.11 | 2% | ||
| SALES (in $m) | |||||||||
| Oil production | 91 | 87 | 97 | 109 | 384 | 337 | 14% | ||
| Gabon | 86 | 83 | 90 | 102 | 361 | 317 | 14% | ||
| Tanzania | 5 | 4 | 7 | 7 | 23 | 20 | 14% | ||
| Drilling operations | 5 | 3 | 4 | 4 | 16 | 14 | 17% | ||
| Consolidated sales (in $m) | 96 | 90 | 101 | 113 | 400 | 351 | 14% | ||
| Consolidated sales (in €m) | 90 | 81 | 86 | 97 | 355 | 317 | 12% | ||
The Group’s consolidated sales for 2017 amounted to $400 million (€355 million), up 14% compared to 2016.
This increase was due to the sharp rise in oil prices in 2017, despite a drop in oil production in Gabon during the period.
The average sale price of oil in fiscal year 2017 rose by 24% to $53/bbl versus $42.7/bbl in 2016.
To meet the higher demand for gas in Tanzania, gas production significantly increased starting in the second half of 2017. For the full year, average production stood at 49.1 MMcf/d at 100%, up 14% over the previous year.
Hydrocarbon production in 2017
| Q1 2017 | Q2 2017 | Q3 2017 | Q4 2017 | 12 months 2017 | 12 months 2016 | Chg.17/16 | ||||
| Production operated by Maurel & Prom (100%) | ||||||||||
| Oil | bopd | 24,303 | 25,104 | 26,290 | 24,144 | 24,963 | 27,195 | -8% | ||
| Gas | MMcf/d | 43.3 | 30.7 | 60.0 | 62.2 | 49.1 | 43.1 | 14% | ||
| TOTAL | boepd | 31,509 | 30,221 | 36,268 | 34,514 | 33,145 | 34,365 | -4% | ||
| Maurel & Prom share of production |
||||||||||
| Oil | bopd | 19,442 | 20,083 | 21,032 | 19,315 | 19,970 | 21,756 | -8% | ||
| Gas | MMcf/d | 20.8 | 14.8 | 28.8 | 29.9 | 23.6 | 20.7 | 14% | ||
| TOTAL | boepd | 22,905 | 22,542 | 25,828 | 24,299 | 23,903 | 25,202 | -5% | ||
Operated oil production in Gabon in the fourth quarter of 2017 amounted to 24,144 bopd, down 8% compared to the previous quarter. This was primarily due to the installation of an autonomous power generation system designed to reduce operating costs. Production was halted during its commissioning, resulting in an estimated loss of 860 bopd in Q4 2017.
To mitigate the Ezanga permit field depletion resulting, among other things, from its development programme being halted for close to three years on account of the drop in oil prices, Maurel & Prom Gabon will resume all of its drilling activities. This programme, set to begin in the first half of 2018, involves drilling 11 development wells and three sidetracks.
In addition, drilling of the first exploration wells on the Kari and Nyanga-Mayomnbé permits will start in the second half of 2018.
In Tanzania, demand for gas from the national company, TPDC, rose steadily in 2017 to reach average production of 62.2 MMcf/d at 100% in Q4 2017.
This demand, which is linked to industrial gas consumption in Dar Es Salam, is expected to increase further in 2018.
Group reserves in M&P share at 31 December 2017 (WI M&P)
The Group’s reserves correspond to the volumes of recoverable hydrocarbons currently in production plus those revealed by discovery and delineation wells that can be operated commercially. These reserves were certified by DeGolyer and MacNaughton in Gabon and RPS Energy in Tanzania as at 31 December 2017.
| Gross P1+P2 reserves M&P’s share |
Oil (MMbbl) | Gas (Bcf) ([1]) |
MMboe | |
| Gabon | Tanzania | |||
| 01/01/2017 | 178.2 | 272.3 | 223.6 | |
| production | -7.2 | -8.8 | ||
| revision | 0.2 | 1.9 | ||
| 31/12/2017 | 171.3 | 265.4 | 215.5 | |
| o/w gross P1 reserves | 134.9 | 146.5 | 159.3 | |
| or | 79% | 55% | 74% |
| P1+P2 reserves net of royalties M&P’s share |
Oil (MMbbl) | Gas (Bcf) (1) |
MMboe | |
| Gabon | Tanzania | |||
| 01/01/2017 | 157.7 | 272.3 | 203.1 | |
| production | -6.8 | -8.8 | ||
| revision | 0.2 | 1.9 | ||
| 31/12/2017 | 151.1 | 265.4 | 195.3 | |
| o/w P1 reserves net of royalties | 119.1 | 146.5 | 143.5 | |
| or | 79% | 55% | 73% |
At 31 December 2017, gross P1+P2 (2P) reserves amounted to 215 MMboe, the equivalent of 195 MMboe in M&P share net of royalties.
In Gabon, 2P reserves net of royalties and restated for 2017 production amounted to 151.1 MMbbls at 31 December 2017, with P1 reserves accounting for 79% of that total. This level of certified reserves reflects the value and success of the work undertaken to optimise the Ezanga field following the drop in oil prices.
At 31 December 2017, the Group also had gas reserves of 265 Bcf.
These gas assets give the Group access to fixed, stable revenues over the long term. The sale price is $3.0441 per thousand cubic feet and rises with inflation. Maurel & Prom thus has cash flow unaffected by oil price fluctuations.
| Français | Anglais | ||
| pieds cubes | pc | cf | cubic feet |
| pieds cubes par jour | pc/j | cfpd | cubic feet per day |
| milliers de pieds cubes | kpc | Mcf | 1,000 cubic feet |
| millions de pieds cubes | Mpc | MMcf | 1,000 Mcf = million cubic feet |
| milliards de pieds cubes | Gpc | Bcf | billion cubic feet |
| baril | b | bbl | barrel |
| barils d’huile par jour | b/j | bopd | barrels of oil per day |
| milliers de barils | kb | Mbbl | 1,000 barrels |
| millions de barils | Mb | MMbbl | 1,000 Mbbl = million barrels |
| barils équivalent pétrole | bep | boe | barrels of oil equivalent |
| barils équivalent pétrole par jour | bep/j | boepd | barrels of oil equivalent per day |
| milliers de barils équivalent pétrole | kbep | Mboe | 1,000 barrels of oil equivalent |
| millions de barils équivalent pétrole | Mbep | MMboe | 1,000 Mbbl = million barrels of oil equivalent |
https://globenewswire.com/news-release/2018/02/05/1332573/0/en/Maurel-Prom-2017-sales-400m-up-14.html
KMG EP reserves update as at 31 December 2017
二月 1, 2018
RNS Number : 4570D
JSC KazMunaiGas Exploration Prod
31 January 2018
�
PRESS-RELEASE
Astana, 31�January 2018. JSC KazMunaiGas Exploration Production (“KMG EP” or the “Company”) announces the results of an independent audit of liquid hydrocarbon reserves at the Ozenmunaigas JSC, Embamunaigas JSC and the Ural Oil and Gas LLP (KMG EP’s share – 50%) fields as at 31 December 2017. The audit was performed by independent consultant DeGolyer and MacNaughton (“D&M”).
According to the D&M report, proved plus probable (2P) reserves of liquid hydrocarbons as at 31 December 2017 were 145 million tonnes (1,065 million barrels), equal to the level at the end of 2016. The reserve replacement ratio (the ratio of increase in reserves to annual production) was 100%.
Proved (1P) reserves of liquid hydrocarbons at 31 December 2017 were 102 million tonnes (754 million barrels), and proved, probable and possible (3P) reserves amounted to 193 million tonnes (1,418 million barrels).
Liquid hydrocarbon reserves as of 31 December 2017
(See Article link for tables)
The report does not include KMG EP’s share in reserves of JV Kazgermunai LLP, CCEL (Karazhanbasmunai) and PetroKazakhstan Inc.
NOTES TO EDITORS
KMG EP is among the top three Kazakh oil producers based on the 2017 results. The overall production in 2017 was 11.9 million tonnes (240 kbopd) of crude oil, including the Company’s share in Kazgermunai, CCEL and PKI. The Company’s volume of proved and probable reserves excluding shares in the associates, at the end of 2016 was 182 million tonnes (1,327 mmbbl). The Company’s shares are listed on the Kazakhstan Stock Exchange and the GDRs are listed on the London Stock Exchange and Kazakhstan Stock Exchange. The Company raised over US$2bn at its IPO in September 2006.
For further details please contact us at:
KMG EP. Investor Relations (+7 7172 97 5433)
Saken Shoshanov
e-mail: ir@kmgep.kz�
KMG EP. Public Relations (+7 7172 97 7887)
Bakdaulet Tolegen
e-mail: pr@kmgep.kz�
�
Finsbury (+44 (0)20 7251 3801)
Dorothy Burwell
e-mail: KMGEP@finsbury.com��
Forward-looking statements
This document includes statements that are, or may be deemed to be, ”forward-looking statements”. These forward-looking statements can be identified by the use of forward-looking terminology including, but not limited to, the terms ”believes”, ”estimates”, ”anticipates”, ”expects”, ”intends”, ”may”, ”target”, ”will”, or ”should” or, in each case, their negative or other variations or comparable terminology, or by discussions of strategy, plans, objectives, goals, future events or intentions. These forward-looking statements include all matters that are not historical facts. They include, but are not limited to, statements regarding the Company’s intentions, beliefs and statements of current expectations concerning, amongst other things, the Company’s results of operations, financial condition, liquidity, prospects, growth, potential acquisitions, strategies and as to the industries in which the Company operates. By their nature, forward-looking statements involve risk and uncertainty because they relate to future events and circumstances that may or may not occur. Forward-looking statements are not guarantees of future performance and the actual results of the Company’s operations, financial condition and liquidity and the development of the country and the industries in which the Company operates may differ materially from those described in, or suggested by, the forward-looking statements contained in this document. The Company does not intend, and does not assume any obligation, to update or revise any forward-looking statements or industry information set out in this document, whether as a result of new information, future events or otherwise. The Company does not make any representation, warranty or prediction that the results anticipated by such forward-looking statements will be achieved.
This information is provided by RNS, The company news service from the London Stock Exchange
NOVATEK Announces Year-End 2017 Reserves
一月 25, 2018
Moscow, 23 January 2018. PAO NOVATEK (“NOVATEK” and/or the “Company”) announced that independent petroleum engineers, DeGolyer & MacNaughton, have completed their comprehensive reserve appraisal of the Company’s hydrocarbon reserves as of 31 December 2017.
Total SEC proved reserves, including the Company’s proportionate share in joint ventures, aggregated 15,120 million barrels of oil equivalent (boe), including 2,098 billion cubic meters (bcm) of natural gas and 164 million metric tons (mmt) of liquid hydrocarbons. Total proved reserves increased by 12.8% compared to the year-end 2016, representing a reserve replacement rate of 435% for the year.
The Company’s reserves were positively impacted by successful exploration works at the Utrennee, Kharbeyskoye, West-Yurkharovskoye and Urengoyskoye (Samburgskiy license area) fields, production drilling at the South-Tambeyskoye field, as well as the new licenses obtained through tender auctions (Gydanskoye, Verhnetiuteyskoye and West-Seyakhinskoye fields) and recent asset acquisitions (South-Khadyryakhinskoye, Syskonsynyinskoye fields and West-Yaroyakhinskiy license area). Excluding the effect of obtaining new licenses, our total proved reserves increased by 1.3%, representing an organic reserve replacement rate of 134%.
At year-end 2017, the Company’s reserve to production ratio (or R/P ratio) was 29 years.
Under the PRMS reserves reporting methodology, the Company’s total proved plus probable reserves, including the Company’s proportionate share in joint ventures, aggregated 28,471 million boe, including 3,879 bcm of natural gas and 366 mmt of liquid hydrocarbons.
NOVATEK reserves according to international standards
Proved reserves under the SEC methodology
***
Information provided in this press release represents expected results of PAO NOVATEK operations in 2017. The information represents preliminary assessment only, which can be adjusted after statistical, financial, fiscal and business reporting becomes available. The information on PAO NOVATEK’s operational results in this press release depends on many external factors and therefore, provided all permanent obligations imposed by the London Stock Exchange listing rules are unconditionally observed, cannot qualify for accuracy and completeness and should not be regarded as an invitation for investment. Therefore, the results and indicators actually achieved may significantly differ from any declared or forecasted results in 2017. PAO NOVATEK assumes no obligation (and expressly declares that it has no such obligation) to update or change any declarations concerning any future results, due to new information obtained, any future events or for any other reasons.
Algerian Sonatrach and Libyan NOC to jointly operate oilfields on mutual borders
一月 17, 2018
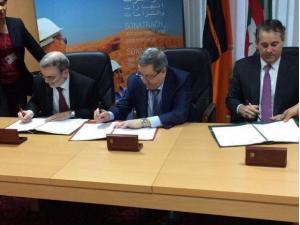
Photo Source: NOC Facebook page. Left to right, NOC Chairman, Mr. Mustafa A. Sanalla; Sonatrach Chairman & CEO, Mr. Abdelmoumen Ould-Kaddour; and D&M Chairman & CEO, Mr. John W. Wallace
Algerian Sonatrach signed Monday an agreement with the Libyan National Oil Corporation (NOC) to run a number of oilfields located on the borders between the two countries, according to a statement on the NOC website.
According to the agreement was a further step on the ground after a study that was carried out on 2006 concerning Al-Rar and Al-Wafaa oilfields that are located on the borders between Algeria and Libya. Al-Rar gas field is located on the Algerian side of the border, while Al-Wafa oilfield is located on the Libyan side of the border.
“If it was proved that the two fields are in fact one field, they will be run and managed jointly by the two countries,” A source from Sonatrach told Anadolu Agency.
“Through the agreement, the two companies decided to update the old study using the technical data collected from January 2008 to present,” the source clarified, adding that the two companies are also seeking to achieve the optimal utilization for the two fields through the agreement.
Sonatrach have been halting all its projects and investments in Libya since 2011.
Source: http://www.libyanexpress.com/algerian-sonatrach-and-libyan-noc-to-jointly-operate-oilfields-on-mutual-borders/
Algeria, Libya agree to jointly manage oil fields on shared border
一月 17, 2018
Algeria’s state-run oil company Sonatrach signed an agreement, Monday, with the Libyan National Oil Corporation (NOC) to run a number of crude oil fields located on the borders between the two countries.
The agreement included updating a study that was carried out on 2006 concerning Al-Rar and Al-Wafa oilfields, which located on the shared borders between Algeria and Libya, according to a statement by Sonatrach.
Al-Rar gas field is located on the Algerian side of the border, while Al-Wafa oilfield is located on the Libyan side of the border.
An official at Sonatrach, who preferred anonymity, told Anadolu Agency, said the study would “clarify the hypothesis of the connection between the Algerian Al-Rar gas field and the Libyan Al-Wafa oil field.”
Read More: Foreign intervention in Libya ‘frustrating progress’
“If it was proved that the two fields are in fact one field, they will be run and managed jointly by the two countries,” the source noted.
In September 2006, DeGolyer & MacNaughton (D&M) conducted a study, which aimed at confirming the existence of a connection between the two fields. The study depended on a data that was provided by Sonatrach and NOC.
“Through the agreement, the two companies decided to update the old study using the technical data collected from January 2008 to present,” the source pointed out, adding that the two companies are also seeking to achieve the optimal utilization for the two fields through the agreement.
Sonatrach have been halting all its projects and investments in Libya since the 2011 Arab Spring.
The oil extraction industry in Libya has been experiencing security hurdles, a fact that has led to a reduction in the country’s daily oil production by 30 per cent.
Source: https://www.middleeastmonitor.com/20180116-algeria-libya-agree-to-jointly-manage-oil-fields-on-shared-border/
署了合作协议
十一月 9, 2017
D&M公司与阿塞拜疆共和国国家石油公司(SOCAR)签署了合作协议,助其改善阿塞拜疆油气田开发效果。
D&M公司董事长兼首席执行官约翰·华莱士(John Wallace)与负责俄罗斯与独联体业务的莫斯科办事处总经理马丁·维威尔罗斯基(Martin Wiewiorowski)本周会见了阿塞拜疆共和国国家石油公司总裁罗夫那格·阿卜杜拉耶夫(Rovnag Abdullayev),并与对方签署合作协议,帮助这一阿塞拜疆国有石油天然气公司改善该国油气田的开发效果。
根据阿塞拜疆政府发表的声明,D&M公司将检查20个油田的开发方案,提出增加石油产量、提高采收率、降低石油开采成本、确定短期战略目标等建议。D&M公司将参与落实所提出的建议。
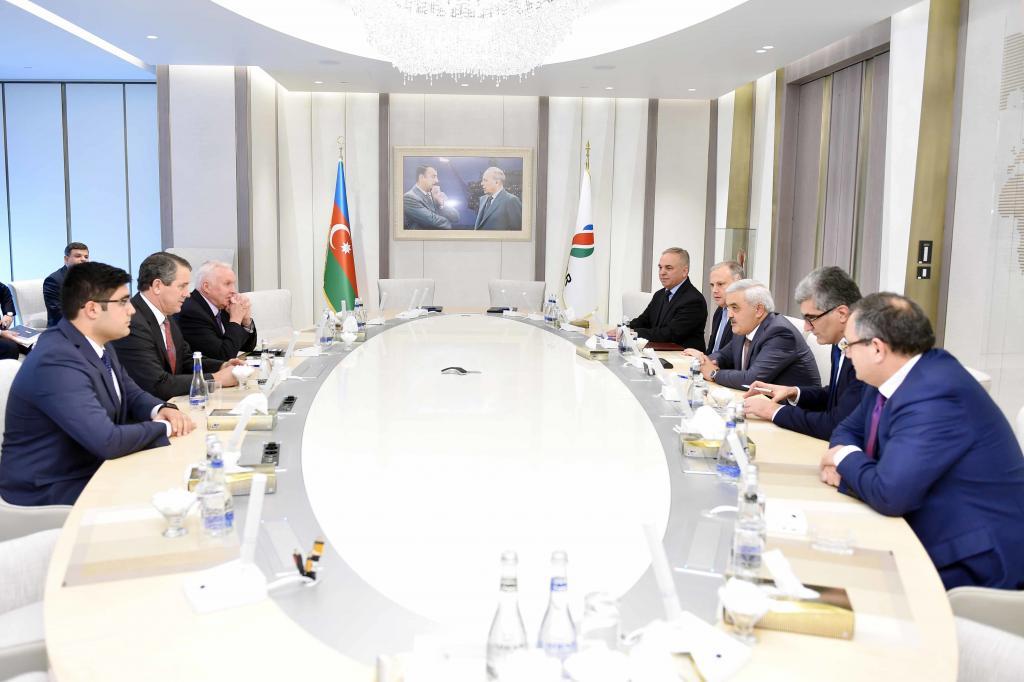
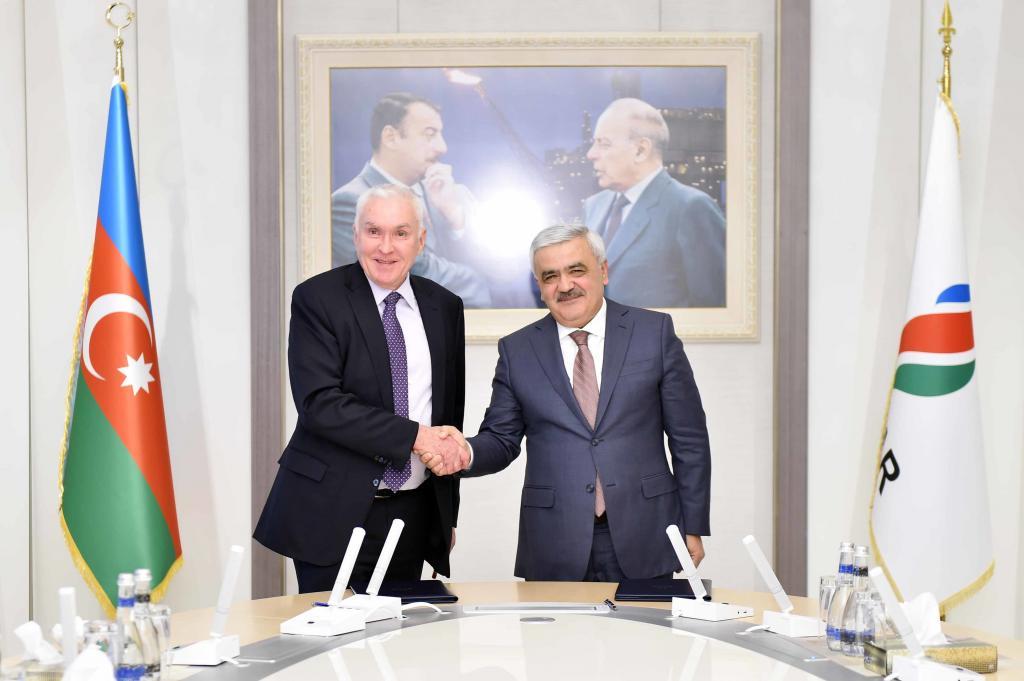
SOCAR announces Cooperative Agreement
D&M公司主办研讨会和高管碰头会
八月 9, 2017
D&M公司主办非常规油气藏研讨会和高管碰头会
重点聚焦油气藏管理和井动态分析
由于其独特的性质,非常规资产为储量和资源量的预测评估提出了巨大的挑战。过去十年间在北美洲,石油公司、作业公司、金融公司以惊人的速度注资、开发非常规资源。随着行业不断进步,虽然钻出了越来越长的分支井开采多层油气藏,但是在准确预测现金流和产量方面,仍然存在尚未解决的重要问题。究其性质而言,非常规资源的开采受储层/流体性质、地质、完井等不同方面的综合影响,因此产量预测并不是简单的曲线拟合练习。
在其举办的“2017年高管碰头会暨非常规资源短训课”系列活动中,D&M公司回顾了解决这些问题的方法,并解答了近来SEC意见函和实践中与储量和资源量评估有关的一些问题。来自D&M公司的客户及非客户共计150多名高管出席了碰头会,到会公司占北美所有上市的上游石油天然气公司60%以上的市值。此外,大量私有公司、投资银行实体、北美及国际主权财富和私人股本公司以及石油超级巨头也都出席了高管碰头会。在高管碰头会上,D&M公司分享了通过对超过40%的北美非常规资源井进行独立年度检查审计而获得的大量深刻见解,详细介绍了D&M公司非常规油气层评价的方法,包括D&M公司将生产诊断、解析分析、模型分析以及静态储层和完井资料结合起来的方法。
“D&M公司的方法是独特的、正确的、非常及时的”—— D&M公司2017年非常规资源高管碰头会与会人员称。
出席碰头会的高管们的总体反馈是,“D&M公司的[非常规资源]方法在[同行中]非常独特,[技术]正确,而且十分及时”。的确,这些高管认为,D&M公司的方法是每天都适用的,并不仅仅只是在储量评估期适用。
D&M公司基于诊断的方法已经由D&M工程师用于检查并更加准确地预测非常规资源井的动态。D&M公司的工程师们带来了独特的知识体,贯穿于应用这一方法的始终。预计通过持续检查此类井,工程师们还将获得更多认识和见解,尤其是随着完井设计的进一步改善、发展,以及预计针对某些地层设立新的经济性标准。
非常规短训班:D&M公司负责领导非常规资源咨询业务的迪尔翰·伊尔克(Dilhan Ilk)博士作了“非常规油气藏单井动态分析与预测”课程。在本课程中,伊尔克博士回顾了产量分析预测方法的理论基础,通过举例详细说明了该方法在大型油气田中的应用,并介绍了从D&M公司工作中得到的见解,帮助改进短训班参加人员自身在非常规资源中从事的工作。
D&M公司在非常规资源评价中所用的一种方法是卡帕工程公司的Citrine油气田产量分析模块(Citrine)。这一新模块是由卡帕工程公司与D&M公司合作开发的,能够快速加载大量公共来源、客户提供或模拟得到的数据,用以处理多口井的数据。该方法特别适用于非常规油气田,Citrine应用可视化趋势识别和多井对比,能够让用户通过应用诊断方法和递减曲线分析充分了解、解释油气田动态。请点击这里,了解更多信息。
如果您有兴趣让伊尔克博士领导贵公司自己举办的 “非常规油气藏单井动态分析及预测” 短训班,请
。除了8月28日在丹佛召开的2017年高管碰头会以外,D&M公司还将在今后进一步举办高管碰头会。
如果您希望参加今后的会议,请
。迪尔翰·伊尔克博士是D&M公司副总裁,也是非常规油气藏井动态分析方面的领导权威。作为每次会议的主要主持人,伊尔克博士认为许多公司都高估了非常规资源井的潜力,或者至少在开采生命期方面的看法是不现实的。

Citrine油气田产量分析
八月 7, 2017
卡帕工程公司与D&M公司合作发布了新的模块,能够快速加载大量公共来源、客户提供或模拟得到的数据,用以处理多口井的数据。该方法特别适用于非常规油气田,Citrine应用可视化趋势识别和多井对比,能够让用户通过应用诊断方法和递减曲线分析充分了解、解释油气田动态。请 点击了解更多)。